Cyber Forensics Investigation
By Himanshu Shekhar | 09 Jan 2022 | (0 Reviews)
Suggest Improvement on Cyber Forensics Investigation — Click here
Introduction to Cyber Forensics
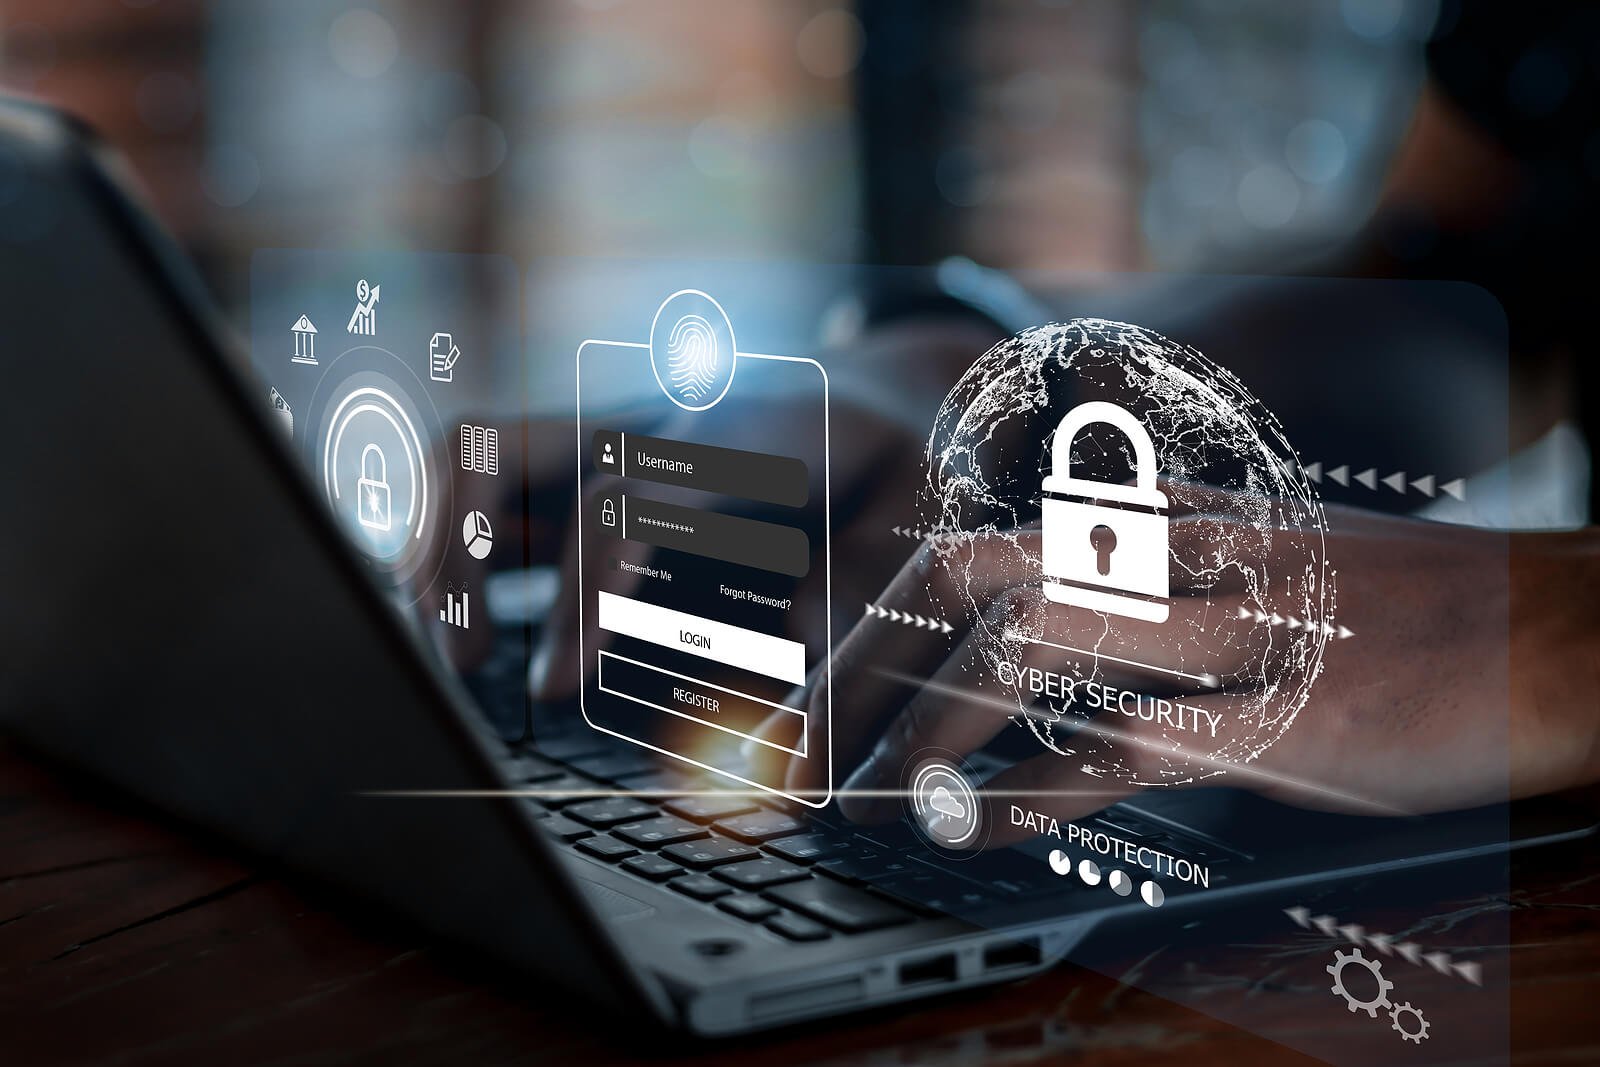
Cyber Forensics (also known as Digital Forensics) is the discipline of identifying, preserving, analyzing, and presenting digital evidence in a legally acceptable manner. This comprehensive module provides an in-depth foundation for understanding the field, its importance, methodologies, challenges, and career opportunities.
Cyber forensics is used in every cybercrime investigation, data breach response, and insider threat case worldwide. This module prepares you for real-world scenarios.
0.1 What is Cyber Forensics?
The Science of Digital Evidence
Cyber Forensics (also referred to as Digital Forensics, Computer Forensics, or Forensic Computing) is the scientific discipline that involves the identification, collection, preservation, analysis, and presentation of digital evidence in a manner that is legally admissible in a court of law.
"Finding, protecting, and explaining digital evidence so it can be used in court."
🔍 Defining Cyber Forensics in Detail
Cyber Forensics applies established scientific methods and investigative techniques to examine digital devices, networks, and storage media to uncover evidence related to cybercrimes, security incidents, policy violations, or civil disputes. It is essentially the application of computer science and investigative procedures to legal matters involving digital evidence.
The term "forensic" comes from the Latin word "forensis", meaning "of or before the forum" — referring to the Roman courts where legal proceedings took place.
Where does "Forensic" come from?
The term comes from the Latin word "forensis" — meaning "of or before the forum" — referring to Roman courts where legal proceedings took place. Thus, cyber forensics is essentially the application of computer science and investigative procedures to legal matters involving digital evidence.
Why is it important?
Almost 90% of crimes today involve digital evidence — from hacking and fraud to homicide investigations. Without cyber forensics, criminals would operate with impunity in the digital world.
🎯 The 4 Core Principles of Cyber Forensics
Every forensic investigation is guided by four fundamental principles that ensure the integrity and admissibility of digital evidence:
Preservation of Evidence Integrity
The most critical principle in cyber forensics is that digital evidence must never be altered. Unlike physical evidence, digital data is extremely fragile and can be modified accidentally or intentionally. Even simply viewing a file can change its last accessed timestamp.
Chain of Custody
The chain of custody is a documented chronological record showing the seizure, custody, control, transfer, analysis, and disposition of evidence. Every person who handles the evidence must be documented, along with the date, time, purpose, and location of access.
Scientific Methodology
Cyber forensics follows the same scientific method as other forensic sciences: hypothesis formation, testing, validation, and peer review. Investigators must use validated tools and techniques that produce repeatable, verifiable results.
Legal Admissibility
Digital evidence is only useful if it can be admitted in court. The Daubert Standard governs admissibility, considering whether methodology has been tested, peer-reviewed, has a known error rate, and is generally accepted in the scientific community.
🔍 Real-World Example: Phishing Attack Investigation
If an investigator hypothesizes that an attacker gained access through a phishing email, they would predict finding:
- A malicious email in the user's mailbox
- The attachment being downloaded
- A malicious process executing
- Network connections to an external IP address
- Data being exfiltrated
Result: Each piece of evidence confirms or disproves the hypothesis.
📊 The 6 Key Components of Cyber Forensics
Every forensic investigation follows these six phases to ensure thorough, defensible results:
Identification
Phase 1Recognizing potential sources of digital evidence and defining the scope of the investigation.
Includes identifying which devices, systems, networks, and accounts may contain relevant evidence. Investigators must also identify potential witnesses, document the scene, and determine legal authority.
Preservation
Phase 2Securing evidence to prevent alteration or loss.
Includes isolating affected systems, capturing volatile data before powering off, creating forensic images, securing evidence in controlled environments, and maintaining chain of custody.
Collection
Phase 3Gathering digital evidence in a forensically sound manner.
Includes hard drives and SSDs (full disk images), RAM dumps, network traffic captures (PCAP files), log files, mobile devices, and cloud accounts.
Examination
Phase 4Processing and extracting data using forensic tools.
Includes file system parsing, deleted file carving, registry parsing, log parsing, indexing, keyword searching, and hash filtering.
Analysis
Phase 5Interpreting evidence to answer investigative questions.
Includes timeline reconstruction, evidence correlation, attack vector identification, lateral movement mapping, data impact assessment, attacker attribution, and root cause analysis.
Presentation
Phase 6Reporting findings clearly for different audiences.
Includes report writing for different audiences (executive, technical, legal), exhibit preparation, peer review, legal review, expert testimony, and remediation recommendations.
🌍 Real-World Applications of Cyber Forensics
Cyber forensics is used across multiple sectors to investigate crimes, resolve disputes, and protect organizations:
Criminal Investigations
Law EnforcementLaw enforcement agencies use cyber forensics to investigate a wide range of crimes:
- Cybercrime: Hacking, malware, DDoS, ransomware
- Financial Fraud: Identity theft, credit card fraud
- Child Exploitation: CSAM possession/distribution
- Terrorism: Communication and planning evidence
- Homicide: Digital evidence linking suspects
- Drug Trafficking: Communication and financial records
Corporate Investigations
Private SectorOrganizations employ forensic investigators to handle internal matters:
- Insider Threats: IP theft, data exfiltration
- Data Breaches: Scope and source of incidents
- Policy Violations: Harassment, misuse of resources
- Litigation Support: eDiscovery for lawsuits
- Mergers & Acquisitions: Due diligence investigations
- Compliance Audits: Regulatory violation detection
Civil Litigation
Legal SectorAttorneys use digital forensics in civil cases to uncover truth and support claims:
- Divorce: Hidden assets, infidelity evidence
- IP Disputes: Trade secret theft, copyright infringement
- Employment: Wrongful termination, discrimination
- Insurance: Fraud investigation, claim verification
- Contract Disputes: Email and document evidence
- Personal Injury: Digital evidence of negligence
📂 Common Types of Digital Evidence
| Evidence Type | Examples | Where to Find |
|---|---|---|
| 📧 Emails | Headers, attachments, content, metadata | Email servers, Outlook PST files, webmail |
| 🌐 Browser Artifacts | History, cookies, cache, downloads, saved passwords | Chrome/Firefox/Edge profile folders |
| 📁 Deleted Files | Documents, photos, videos, databases | Unallocated space, slack space |
| 📜 Log Files | Authentication, system, application, security | Windows Event Logs, /var/log/ |
| 🔑 Registry | USB history, program execution, user activity | Windows Registry (SAM, SYSTEM, NTUSER.DAT) |
| 🌐 Network Traffic | PCAP files, NetFlow, firewall logs | Network captures, SIEM |
Key Takeaway
Cyber forensics is both a technical science (how to find and analyze evidence) and a legal discipline (how to make evidence admissible in court). Mastering both aspects is essential for success in this field. Digital evidence is only valuable if it can be properly collected, preserved, analyzed, and presented in a legally acceptable manner.
✅ Check Your Understanding
Answer: "Of or before the forum" (Roman courts)
Answer: Preserving evidence integrity (never alter original evidence)
Answer: Proves evidence wasn't tampered with; required for court admissibility
Answer: Always on forensic copies (images), never originals
Answer: Preservation, Chain of Custody, Scientific Method, Legal Admissibility
Answer: Approximately 90%
0.2 Need for Cyber Forensics
Why Organizations and Society Require Digital Investigation
In today's digital age, almost every aspect of our lives—personal, professional, and social—leaves a digital footprint. With the exponential growth of cybercrime and increasing reliance on technology, cyber forensics has become an essential discipline for organizations, law enforcement, legal professionals, and society as a whole.
$10.5T
Global cybercrime damages by 2025
More profitable than all illegal drugs combined
72 Hours
GDPR breach notification deadline
Fines up to €20M or 4% of global revenue
$2.66M
Average savings with incident response teams
Per data breach (IBM Report)
90%
of crimes involve digital evidence
From hacking to homicide investigations
🔐 1. Increasing Cybercrime Rates
Cybercrime has grown exponentially over the past decade, with no signs of slowing down. According to Cybersecurity Ventures, global cybercrime damages are projected to reach $10.5 trillion annually by 2025, making cybercrime more profitable than the global trade of all major illegal drugs combined.
Ransomware Attacks
Criminals encrypt data and demand payment. Forensics identifies entry vector, tracks ransom payment, and often recovers decryption keys from memory.
Phishing & BEC
Attackers trick employees into transferring funds or revealing credentials. Email forensics traces source and identifies compromised accounts.
Data Breaches
Sensitive customer or corporate data is stolen. Forensics determines what was taken, how attackers gained access, and provides evidence for legal action.
Insider Threats
Current or former employees steal data or sabotage systems. Forensics uncovers unauthorized access, data transfers, and policy violations.
⚖️ 2. Legal and Regulatory Compliance
Governments and regulatory bodies worldwide have enacted laws that mandate the preservation and reporting of digital evidence. Organizations that fail to comply face severe penalties, including fines, lawsuits, and reputational damage.
| Regulation | Requirement | Penalty for Non-Compliance |
|---|---|---|
| GDPR (EU) | Report data breaches within 72 hours, protect personal data | Fines up to €20M or 4% of global annual revenue |
| HIPAA (US) | Protect patient health information, breach notification | Fines up to $1.5M per violation category per year |
| PCI-DSS (Global) | Maintain security controls for credit card data | Fines up to $100K/month, loss of processing privileges |
| SOX (US) | Maintain accurate financial records, report security incidents | Fines up to $5M, imprisonment up to 20 years |
| FISMA (US) | Federal agencies must implement security controls | Loss of funding, public scrutiny |
🏢 3. Corporate Governance and Risk Management
Corporate boards and executives have a fiduciary duty to protect shareholder value. Cyber forensics supports good governance by investigating insider threats, enforcing acceptable use policies, supporting HR investigations, and reducing legal liability.
Insider Threat Detection
Identify unauthorized access and data exfiltrationPolicy Enforcement
Investigate policy violations and misuseHR Support
Confirm or refute misconduct claimsLiability Reduction
Limit legal exposure with proper documentation🛡️ 4. Incident Response and Business Continuity
When a security incident occurs, time is critical. Every hour of downtime can cost organizations hundreds of thousands of dollars. Cyber forensics is an essential component of incident response.
Rapid Triage
Determine scope & severityContainment
Isolate compromised systemsEradication
Remove malware & backdoorsRecovery
Restore normal operationsLessons Learned
Prevent future incidents💰 5. Financial Fraud Investigation
Financial fraud costs the global economy trillions of dollars annually. Cyber forensics is essential for investigating embezzlement, money laundering, accounting fraud, insurance fraud, and tax evasion.
Embezzlement
Tracing digital transactions to identify stolen fundsMoney Laundering
Following the digital trail of illicit proceedsAccounting Fraud
Examining digital records to identify falsified entries👥 6. Employee Misconduct and HR Investigations
Digital evidence plays a crucial role in workplace investigations, including harassment and discrimination, theft of time, non-competition violations, and confidentiality breaches.
⚔️ 7. National Security and Law Enforcement
Government agencies and law enforcement rely on cyber forensics to protect national security and prosecute criminals:
- Terrorism Investigations: Communication and planning evidence
- Child Exploitation: Identifying victims and tracking perpetrators
- Drug Trafficking: Communication and financial records
- Cyber Espionage: Identifying nation-state actors
Key Takeaway
Cyber forensics is not optional—it is essential. Organizations that lack forensic capabilities are vulnerable to undetected breaches, unable to respond effectively to incidents, and at risk of legal penalties. The cost of implementing forensics is far less than the cost of a major breach.
✅ Check Your Understanding
Answer: $10.5 trillion annually
Answer: 72 hours
Answer: $2.66 million on average
Answer: Approximately 90%
Answer: GDPR, HIPAA, PCI-DSS, SOX, FISMA
Answer: $500 million
0.3 Cyber Forensics vs Digital Forensics
The terms Cyber Forensics and Digital Forensics are often used interchangeably, but there are important distinctions. Understanding these differences is crucial for professionals choosing career paths, organizations building capabilities, and students planning their education.
📊 Understanding the Terminology
Digital Forensics is the broader discipline that encompasses the investigation of any digital device or electronic data. It applies to any situation where digital evidence may exist, regardless of whether a cybercrime occurred.
📱 Devices Examined:
- Computers and Laptops
- Mobile Devices (phones, tablets)
- Storage Media (USB drives)
- IoT Devices (smart home)
- Vehicle Systems (black boxes)
- Gaming Consoles
- Cameras and Drones
- Printers and Copiers
Cyber Forensics is a specialized subset of digital forensics that focuses specifically on cybercrimes—illegal activities conducted using computers, networks, or the internet as tools, targets, or both.
🎯 Key Focus Areas:
- Network Forensics: Packet captures, firewall logs, IDS alerts
- Malware Analysis: Static and dynamic malware examination
- Memory Forensics: RAM analysis, fileless malware detection
- Incident Response: Breach investigation and containment
- Attack Attribution: Tracing attacks to specific actors
📋 Detailed Comparison: Cyber Forensics vs Digital Forensics
| Aspect | Digital Forensics | Cyber Forensics |
|---|---|---|
| Scope | Broader - includes any digital device (phones, tablets, IoT, cameras, vehicles, gaming consoles) | Narrower - focuses on cybercrimes, networks, computers, and internet-related incidents |
| Primary Focus | Data extraction, recovery, and analysis from any digital source | Attack investigation, network traffic analysis, malware analysis, incident response |
| Typical Cases | Civil litigation, divorce, IP theft, employee misconduct, policy violations | Hacking, malware, ransomware, data breaches, cyber espionage, DDoS attacks |
| Typical Clients | Law firms, corporate legal departments, HR, private investigators, individuals | Law enforcement (FBI, Secret Service), cybersecurity teams, incident responders, government agencies |
| Key Skills | File system analysis, data recovery, eDiscovery, report writing, chain of custody | Network analysis, memory forensics, malware analysis, threat hunting, intrusion detection |
| Common Tools | FTK, EnCase, Autopsy, X-Ways, Cellebrite, Oxygen | Wireshark, tcpdump, Volatility, Snort, Suricata, SecurityOnion, IDA Pro |
| Evidence Types | Files, emails, photos, documents, chat logs, browser history, deleted data | Network packets, firewall logs, IDS alerts, memory dumps, malware binaries, C2 traffic |
| Legal Context | Often civil litigation, internal investigations, regulatory compliance | Often criminal prosecution, national security, major incident response |
🔄 Overlap and Intersection
While there are distinctions, the two disciplines overlap significantly. Many investigations require both digital and cyber forensics skills. For example:
📊 Data Breach Investigation
Requires digital forensics (analyzing affected systems, recovering logs) AND cyber forensics (analyzing network traffic, identifying attack vectors).
🦠 Ransomware Attack
Requires cyber forensics (analyzing malware, tracing C2 communication) AND digital forensics (recovering encrypted files, examining system artifacts).
👤 Insider Threat Case
May involve digital forensics (reviewing files accessed) AND cyber forensics (analyzing network transfers, identifying data exfiltration).
🎓 Career Implications
- eDiscovery Specialist
- Forensic Analyst (corporate/law firm)
- Computer Forensic Examiner (law enforcement)
- Litigation Support Specialist
- Incident Responder
- Threat Hunter
- Malware Analyst
- Network Forensic Analyst
- Cybercrime Investigator (FBI/SS)
- DFIR Analyst (Digital Forensics & Incident Response)
- Forensic Consultant
- SOC Analyst with Forensic Capabilities
📐 Relationship Between Disciplines
├── Computer Forensics
├── Mobile Forensics
├── Database Forensics
├── IoT Forensics
├── Cloud Forensics
├── Email Forensics
└── ▶ Cyber Forensics (Specialized Subset)
Key Takeaway
Digital forensics is the broader umbrella that includes cyber forensics. Cyber forensics focuses specifically on crimes involving computers, networks, and the internet. Professionals often benefit from skills in both areas, as many investigations require both disciplines.
✅ Check Your Understanding
Answer: Digital Forensics
Answer: Hacking, ransomware, data breaches, cyber espionage
Answer: Wireshark, Volatility, Snort, IDA Pro
Answer: Civil litigation, divorce, IP theft, employee misconduct
Answer: FTK, EnCase, Autopsy, Cellebrite
Answer: Digital Forensics and Incident Response Analyst (hybrid role)
0.4 Goals and Objectives of Cyber Forensics
Cyber forensics serves multiple critical goals that extend beyond simply finding evidence. Understanding these goals helps investigators focus their efforts and prioritize actions.
🎯 Primary Goals of Cyber Forensics
Preserve Evidence Integrity
The most fundamental goal is to preserve the integrity of digital evidence from collection through presentation. Digital evidence is extremely fragile and can be altered accidentally or intentionally.
Identify Attack Vectors
Understanding how an attacker gained access is crucial for both investigation and preventing future incidents. Attack vectors are the paths attackers use to compromise systems.
Reconstruct Timelines
Timeline reconstruction involves creating a chronological sequence of events to understand exactly what happened, when it happened, and in what order.
Support Legal Proceedings
Digital evidence is only useful if it can be admitted in court. The goal is to produce evidence that meets legal standards for admissibility.
Attribute Actions to Users
Attribution involves linking specific actions to specific users or systems. This is challenging where accounts can be shared, compromised, or spoofed.
Quantify Impact & Scope
Organizations need to understand the full impact of a security incident to make informed decisions about response, remediation, and communication.
Prevent Future Incidents
The ultimate goal of cyber forensics is not just to investigate past incidents but to prevent future ones. Findings from forensic investigations should drive security improvements.
Patch Vulnerabilities
Update software to fix exploited vulnerabilitiesImprove Configurations
Strengthen security settings based on attacker methodsEnhance Monitoring
Add logging and alerting for attacker activities observedUpdate Policies
Revise acceptable use, access control, or incident response policiesProvide Training
Educate employees on phishing, social engineering, and security best practicesImplement Controls
Multi-factor authentication, network segmentation, endpoint detectionReal-World Example: Complete Investigation
A company discovers a data breach. The forensic investigator:
- Preserves evidence by imaging all affected systems
- Identifies the attack vector (phishing email with malicious attachment)
- Reconstructs the timeline from initial access to data exfiltration
- Supports legal proceedings with admissible evidence
- Attributes actions to specific user accounts and IP addresses
- Quantifies the impact (50,000 customer records stolen)
- Prevents future incidents by recommending security improvements
📊 Timeline Reconstruction Sources
File System
MACB TimestampsEvent Logs
Windows, SyslogNetwork Logs
Firewall, IDS, PCAPRegistry
USB History, ExecutionsComplete Timeline
Attack ReconstructionKey Takeaway
The goals of cyber forensics extend far beyond finding evidence. Investigators must preserve integrity, identify attack vectors, reconstruct timelines, support legal proceedings, attribute actions, quantify impact, and prevent future incidents. Mastering all these objectives requires both technical expertise and investigative judgment.
✅ Check Your Understanding
Answer: Preserving evidence integrity
Answer: What happened, when it happened, and in what order
Answer: Write blockers, forensic imaging, hashing
Answer: Linking specific actions to specific users or systems
Answer: Preventing future incidents
Answer: Phishing emails, exploited vulnerabilities, weak credentials
0.5 Types of Cyber Forensics
Cyber forensics encompasses several specialized sub-disciplines, each with its own tools, techniques, and evidence types. Understanding these branches helps investigators know when to apply specific methodologies and which experts to involve.
Computer Forensics
The most established branch, focusing on the analysis of computers, storage devices, and file systems. Examines hard drives, SSDs, USB drives, and other storage media to recover and analyze digital evidence.
Network Forensics
Involves monitoring, capturing, and analyzing network traffic to investigate security incidents, identify malicious activity, and reconstruct network sessions.
Mobile Device Forensics
Focuses on extracting and analyzing data from smartphones, tablets, and wearables. Mobile devices often contain more personal and behavioral data than computers.
Memory Forensics
Also called RAM forensics. Analyzes volatile memory dumps to detect malware, rootkits, and in-memory artifacts that never touch the hard drive.
Cloud Forensics
Applies forensic principles to cloud computing environments (IaaS, PaaS, SaaS), where data may be distributed across multiple servers, jurisdictions, and service providers.
Malware Forensics
Also called Malware Analysis. Examines malicious software to understand its capabilities, origin, and impact. Essential for incident response and threat intelligence.
Database Forensics
Focuses on examining database systems (MySQL, PostgreSQL, SQL Server, Oracle) for evidence of data theft, manipulation, or unauthorized access.
Key Takeaway
Cyber forensics is not a single discipline but a collection of specialized branches. Each branch requires specific knowledge, tools, and techniques. Many investigators specialize in one or two branches while maintaining foundational knowledge of others.
✅ Check Your Understanding
Answer: Memory Forensics
Answer: Packet captures, firewall logs, IDS alerts, network traffic
Answer: FTK Imager, Autopsy, EnCase
Answer: Mobile Device Forensics
Answer: Volatility Framework
Answer: Seven (7) major branches
0.6 Cyber Forensics Lifecycle (6 Phases)
The cyber forensics lifecycle is a systematic, repeatable process that ensures evidence integrity, legal admissibility, and thorough investigation. Following a standardized process is essential for producing defensible results.
🔄 The Complete Forensic Investigation Process
Identification
Define scope & detectPreservation
Secure & isolateCollection
Gather evidenceExamination
Process dataAnalysis
Interpret findingsPresentation
Report & testifyPurpose: Recognize that an incident has occurred and define the scope of the investigation.
📋 Key Activities:
- Incident detection: Identifying potential security incidents through alerts, user reports, system anomalies, or third-party notifications
- Scope definition: Determining which systems, networks, time periods, and data sources are relevant
- Evidence source identification: Identifying computers, servers, mobile devices, cloud accounts, logs
- Legal authority verification: Confirming search warrant, subpoena, or written consent
- Team assembly: Assigning investigators with appropriate skills
Purpose: Secure and isolate evidence to prevent alteration, loss, or contamination.
📋 Key Activities:
- Scene documentation: Photographing the physical scene, documenting device locations, recording system status
- Volatile data capture: Collecting RAM, running processes, network connections BEFORE powering off
- Network isolation: Disconnecting affected systems to prevent remote tampering
- Forensic imaging: Creating bit-for-bit copies using write blockers
- Chain of custody initiation: Beginning documentation of evidence handling
- Secure storage: Placing evidence in controlled environments with access logs
Purpose: Gather digital evidence from all identified sources in a forensically sound manner.
📋 Key Activities:
- Disk image collection: Acquiring forensic images from hard drives, SSDs, USB drives
- Memory image collection: Capturing RAM dumps from live systems
- Network evidence collection: Exporting firewall logs, IDS alerts, proxy logs, PCAP files
- Log collection: Gathering system logs, application logs, authentication logs
- Cloud evidence collection: Using APIs to collect logs from AWS, Azure, GCP
- Mobile device collection: Performing logical, file system, or physical extraction
- Witness interviews: Interviewing relevant individuals for context
Purpose: Process and extract relevant data from collected evidence using forensic tools.
📋 Key Activities:
- Image processing: Loading forensic images into analysis tools (FTK, EnCase, Autopsy)
- File system parsing: Reconstructing file systems to view files, directories, metadata
- Deleted file carving: Recovering files from unallocated space and slack space
- Registry parsing: Extracting Windows Registry data (user accounts, USB history, program execution)
- Log parsing: Converting raw log files into structured formats
- Indexing: Creating searchable indexes of file content and metadata
- Keyword searching: Searching for relevant terms (usernames, IPs, file names)
- Hash filtering: Excluding known good files using NSRL
Purpose: Interpret examined data to answer investigative questions and draw conclusions.
📋 Key Activities:
- Timeline reconstruction: Correlating timestamps to create chronological sequence of events
- Evidence correlation: Linking evidence across different sources
- Attack vector identification: Determining how attacker gained initial access
- Lateral movement mapping: Tracing attacker movement through the network
- Data impact assessment: Identifying what data was accessed, copied, modified, or stolen
- Attacker attribution: Linking actions to specific user accounts, IP addresses, or threat actor groups
- Root cause analysis: Identifying vulnerabilities that enabled the incident
- Hypothesis testing: Formulating and testing theories about what occurred
Purpose: Present findings in a clear, understandable, and legally defensible manner.
📋 Key Activities:
- Report writing: Creating structured reports for different audiences (executive, technical, legal)
- Exhibit preparation: Preparing evidence exhibits for court or client presentations
- Peer review: Having another qualified examiner review findings for accuracy
- Legal review: Having legal counsel review reports for admissibility
- Expert testimony: Testifying in court as an expert witness
- Recommendations: Providing actionable recommendations to prevent future incidents
📊 Timeline Reconstruction Sources
File System
MACB TimestampsEvent Logs
Windows, SyslogNetwork Logs
Firewall, IDS, PCAPRegistry
USB History, ExecutionsComplete Timeline
Attack ReconstructionKey Takeaway
The forensic lifecycle is not always linear—investigators may need to return to earlier phases as new evidence is discovered. However, following a structured process ensures thoroughness, repeatability, and legal defensibility.
✅ Check Your Understanding
Answer: Identification
Answer: Volatile data (RAM, processes, network connections)
Answer: Process and extract relevant data using forensic tools
Answer: Findings document, event timeline, impact assessment
Answer: Final forensic report, evidence exhibits, remediation recommendations
Answer: Identification, Preservation, Collection, Examination, Analysis, Presentation
0.7 Challenges in Cyber Forensics
Cyber forensics professionals face numerous technical, legal, and operational challenges. Understanding these challenges helps investigators prepare for difficult situations and develop strategies to overcome them.
1. Encryption
Challenge: Full-disk encryption (BitLocker, FileVault, LUKS, VeraCrypt) prevents access to data without the decryption key. Attackers increasingly use encryption to protect their data, and legitimate users may refuse to provide passwords.
📌 Impact:
Encrypted drives may be unreadable, potentially losing critical evidence. Legal processes to compel password disclosure can take weeks or months.
2. Anti-Forensics
Challenge: Attackers actively use anti-forensic techniques to evade detection, destroy evidence, and complicate investigations.
📌 Common Methods:
Data wiping, log tampering, timestamp manipulation (timestomping), steganography, encryption, obfuscation, fileless malware
3. Volume of Data (Big Data)
Challenge: Modern storage capacities are enormous. A single enterprise server can contain 10+ terabytes of data. Analyzing that much data manually is impossible.
📌 Impact:
Investigations take longer, require more storage, and need specialized tools and infrastructure. Keyword searches across terabytes can take days.
4. Cloud & Jurisdictional Issues
Challenge: Data stored in the cloud may be distributed across multiple servers, data centers, and countries with different data protection laws.
📌 Impact:
Evidence may be subject to different legal standards, difficult to obtain without provider cooperation, and may be deleted if not preserved quickly.
5. Rapidly Evolving Technology
Challenge: New operating systems, applications, devices, and technologies emerge constantly. Forensic tools may not support the latest versions.
📌 Impact:
Investigators may be unable to examine newer devices or may miss evidence stored in new artifact locations. Tool vendors may take months to add support.
6. Chain of Custody Integrity
Challenge: Any break in the chain of custody documentation can render evidence inadmissible. Maintaining perfect documentation across multiple handlers is difficult.
📌 Impact:
Even if evidence is perfectly preserved, poor documentation can cause it to be rejected in court. Defense attorneys will aggressively challenge chain of custody.
7. Timeliness & Volatile Data Loss
Challenge: Volatile data (RAM, running processes, network connections) disappears immediately when a system is powered off. Investigators must act quickly.
📌 Impact:
If volatile data is not captured before power-off, critical evidence may be lost forever (encryption keys, fileless malware, active network connections).
8. Legal & Privacy Constraints
Challenge: Forensic investigators must operate within legal boundaries. Privacy laws, data protection regulations, and jurisdictional limitations restrict evidence collection.
📌 Impact:
Improper evidence collection can violate privacy laws, result in evidence suppression, or lead to civil liability for the investigator or client.
9. Tool Validation & Reliability
Challenge: Forensic tools must be validated to produce accurate, repeatable results. Defense attorneys may challenge findings if tools are not properly validated.
📌 Impact:
Unvalidated tool results may be excluded from court. Investigators may need to spend significant time defending tool reliability during testimony.
10. Resource & Budget Constraints
Challenge: Forensic investigations require significant resources: skilled personnel, specialized tools, storage capacity, and processing power. Many organizations lack adequate resources.
📌 Impact:
Under-resourced investigations may miss critical evidence, take too long, or produce incomplete results. Backlogs of pending cases are common in underfunded labs.
📊 Order of Volatility (RFC 3227)
CPU/Cache
Most VolatileRAM
MemoryNetwork
ConnectionsLogs
System LogsDisk
StorageBackups
Least VolatileKey Takeaway
Cyber forensics professionals must navigate numerous technical and legal challenges. Success requires continuous learning, careful documentation, legal awareness, and creative problem-solving. The best investigators anticipate challenges and develop mitigation strategies before they encounter problems.
✅ Check Your Understanding
Answer: Full-disk encryption preventing data access without decryption key
Answer: Data wiping, log tampering, timestamp manipulation, steganography
Answer: Priority order for collecting evidence from most to least volatile (RFC 3227)
Answer: Any break can render evidence inadmissible in court
Answer: Jurisdictional issues and cross-border data laws
Answer: Use court-accepted tools, verify with multiple tools, document everything
0.8 Career Paths in Cyber Forensics
Cyber forensics offers diverse and rewarding career paths in law enforcement, corporate security, consulting, government, and private practice. The demand for qualified forensic investigators continues to grow as cybercrime increases and organizations recognize the need for forensic capabilities.
📊 Career Paths and Roles
Digital Forensics Analyst
Description: Examines digital evidence from computers, mobile devices, and storage media to support criminal investigations, civil litigation, or internal corporate investigations.
Incident Responder
Description: Responds to security incidents in real-time, containing breaches, eradicating threats, and recovering systems. Combines forensic analysis with live response techniques.
Malware Analyst
Description: Examines malicious software to understand its capabilities, origin, and impact. Provides intelligence for incident response and threat detection.
Forensic Consultant
Description: Provides expert forensic services to multiple clients on a contract basis. May specialize in mobile forensics, cloud forensics, or eDiscovery.
eDiscovery Specialist
Description: Manages the identification, preservation, collection, processing, and production of electronically stored information (ESI) for litigation.
Law Enforcement Forensic Examiner
Description: Works within law enforcement agencies to examine digital evidence for criminal investigations. Often testifies as an expert witness in court.
Cloud Forensics Specialist
Description: Specializes in collecting and analyzing evidence from cloud environments (AWS, Azure, GCP, SaaS). Navigates unique challenges of multi-tenancy and API-based evidence collection.
📜 Recommended Certifications
| Certification | Issuing Body | Focus Area | Experience Required |
|---|---|---|---|
| CHFI (Computer Hacking Forensic Investigator) | EC-Council | Comprehensive computer forensics | 2 years recommended |
| GCFE (GIAC Certified Forensic Examiner) | SANS Institute | Windows forensics | None (training required) |
| GCFA (GIAC Certified Forensic Analyst) | SANS Institute | Advanced incident response & threat hunting | Experience recommended |
| EnCE (EnCase Certified Examiner) | OpenText | EnCase forensic software | Training + exam |
| CCFE (Certified Computer Forensic Examiner) | ISFCE | General computer forensics | None |
| Cellebrite CCE (Certified Examiner) | Cellebrite | Mobile device forensics | Training + exam |
| CCFP (Certified Cyber Forensics Professional) | (ISC)² | Advanced cyber forensics | 5 years experience |
🎓 Educational Pathways
Bachelor's Degree
Computer Science, Cybersecurity, Digital Forensics, Criminal Justice with digital focusMaster's Degree
Digital Forensics, Cybersecurity, Information Security (advantageous for senior roles)Alternative Paths
Military training, law enforcement academy, intensive certification programs📈 Job Outlook and Growth
Projected Growth
2023-2033 (BLS)Drivers
Increasing cybercrime, regulatory requirements, corporate security awarenessHot Markets
Washington DC, New York, San Francisco, London, Singapore🛠️ Essential Skills for Success
- Operating systems (Windows, Linux, macOS)
- File systems (NTFS, FAT, EXT, APFS)
- Forensic tools (FTK, EnCase, Autopsy, X-Ways)
- Memory forensics (Volatility)
- Network analysis (Wireshark, tcpdump)
- Mobile forensics (Cellebrite, Oxygen)
- Scripting (Python, PowerShell)
- Attention to detail
- Critical thinking and problem-solving
- Written and verbal communication
- Courtroom testimony and presentation
- Ethical judgment and integrity
- Project management
- Continuous learning mindset
🚀 How to Get Started Today
- Learn the Basics (0-3 months):
- Understand computer hardware, operating systems, and networking
- Complete free online courses (Cybrary, YouTube, Coursera)
- Read "Digital Forensics and Incident Response" by Gerard Johansen
- Get Hands-On (3-6 months):
- Download and practice with FTK Imager (free)
- Install Autopsy and analyze sample images from DigitalCorp
- Set up a virtual lab using VirtualBox or VMware
- Complete CTF challenges (CyberDefenders, Blue Team Labs Online)
- Get Certified (6-12 months):
- Start with entry-level: CHFI or CCFE
- Progress to advanced: GCFE or GCFA (requires SANS training)
- Consider vendor-specific: EnCE or Cellebrite CCE
- Gain Experience (12-24 months):
- Apply for junior forensic analyst positions
- Seek internships with law enforcement or consulting firms
- Volunteer for digital forensic organizations
- Build a portfolio of case studies and report samples
- Network and Grow:
- Join professional organizations (IACIS, HTCIA, ISFCE)
- Attend conferences (SANS DFIR Summit, Forensic 4:Cast)
- Participate in online communities (r/computerforensics, DFIR Discord)
- Follow industry experts on LinkedIn and Twitter/X
Final Thought
Cyber forensics is a challenging but immensely rewarding career. Every investigation helps uncover the truth, bring criminals to justice, protect organizations, and make the digital world safer. With the right skills, certifications, and dedication, you can build a successful career in this growing field.
✅ Check Your Understanding
Answer: 32%
Answer: Digital Forensics Analyst, Incident Responder, Malware Analyst
Answer: $90,000 - $180,000
Answer: GCFE (GIAC Certified Forensic Examiner)
Answer: OS knowledge, file systems, forensic tools, memory forensics, network analysis
Answer: Learn the basics (computer hardware, OS, networking)
🎓 Module 00 : Introduction to Cyber Forensics Successfully Completed
You have successfully completed this module of Cyber Forensics Investigation.
Keep building your expertise step by step — Learn Next Module →
Forensics Readiness & Investigation Framework
This module covers the foundational framework for digital forensic investigations, including forensic readiness, lab setup, incident response integration, investigator roles, and professional ethics. Understanding these concepts is essential for establishing a robust forensic capability within any organization.
Forensic readiness is not about responding to incidents — it's about being prepared before incidents occur.
00A.1 What is Forensic Readiness?
📋 Definition of Forensic Readiness
Forensic Readiness is defined as: "The achievement of an appropriate level of capability by an organization in order for it to be able to collect, preserve, protect and analyse digital evidence so that this evidence can be effectively used in any legal matters, in disciplinary matters or in court of law."
Forensic readiness refers to an organization's ability to make optimal use of digital evidence in a limited period of time and with minimal investigation costs.
00A.2 Benefits of Forensic Readiness
Fast & Efficient Investigation
Minimal breakdown to the business during investigations.
Security from Cybercrimes
Protection against IP theft, fraud, and extortion.
Reduced Investigation Costs
Structured storage reduces expense and time.
Improved Law Enforcement Interface
Better collaboration with law enforcement agencies.
Easy Evidence Identification
Quick identification of evidence related to potential crimes.
Positive Legal Outcomes
Proper usage of evidence for positive legal outcomes.
Organizational Defense
Helps the organization use digital evidence in its own defense.
Blocks Attackers
Prevents attackers from covering their tracks.
Regulatory Compliance
Limits costs of regulatory or legal requirements for data disclosure.
Future Attack Prevention
Helps avoid similar attacks in the future.
00A.3 Forensic Readiness Planning
Forensic readiness planning refers to a set of processes required to achieve and maintain forensic readiness.
📋 Key Planning Components
Identify potential evidence required for an incident
Determine the source of the evidence
Define a policy for legally extracting electronic evidence with minimal disruption
Policy for securely handling and storing collected evidence
Identify if the incident requires full or formal investigation
Train staff to handle incidents and preserve evidence
Create a special process for documenting procedures
Establish a legal advisory board to guide the investigation process
00A.4 Setting Up a Computer Forensics Lab
🏢 What is a Computer Forensics Lab (CFL)?
A Computer Forensics Lab is a location designated for conducting computer-based investigations with regard to collected evidence. The lab houses instruments, software and hardware tools, suspect media, and forensic workstations required to conduct the investigation.
🎯 Purpose of a CFL
- Secure evidence handling
- Specialized analysis environment
- Controlled access and chain of custody
- Legal and procedural compliance
00A.5 Steps to Setting Up a Forensics Lab
Planning & Budgeting
Define scope, resources, and budgetPhysical Location & Design
Site selection and structural planningWork Area Consideration
Workstation setup and workspace layoutPhysical Security
Access control, CCTV, secure storageHuman Resources
Staffing, training, and certificationLab Licensing
Legal certification and accreditation00A.6 Lab Planning & Budgeting Considerations
- 📊 Types of investigation to be conducted
- 📈 Number of cases expected
- 👥 Number of investigators/examiners required
- 🖥️ Forensic and non-forensic workstation requirements
- 🏢 Space occupied and equipment required
- 💻 Necessary software and hardware
- 📚 Reference materials
- 🔒 Safe locker for original evidence
- 🌐 LAN and Internet connectivity
- 📦 Storage shelves for unused equipment
00A.7 Physical Location & Structural Design
- Site of the lab
- Access to emergency services
- Physical milieu of the lab
- Design of parking facility
- Dedicated Internet and communication lines
- Multiple backups for communication lines
- A dedicated network
- Appropriate room size
- Good ventilation & air-conditioning
- Good electricity supply
- Emergency power & lighting systems
- UPS backup systems
00A.8 Work Area Considerations
- Ideal lab consists of two forensic workstations & one ordinary workstation with Internet connectivity
- Forensics workstations vary according to case types & processes
- Ample space for case discussions among investigators
- Comfortable environment for long working hours
- Ceiling height, walls, flooring contribute to ambience
- Lighting, room temperature & communication are important factors
00A.9 Computer Forensics as Part of Incident Response Plan
🚨 What is Incident Response?
Incident response is a process of responding to incidents that may have occurred due to security breach in the system or network.
📌 Key Objectives
- Minimizes damage and reduces recovery time and costs
- Identifies how breach occurred
- Locates the method of breach
- Reduces the impact of breach
⚖️ Forensic Role in IR
- Finding & analyzing evidence to determine the culprit
- Legally sound evidence collection
- Tracking and prosecuting perpetrators
- Organizations include IR plan for legal prosecution
00A.10 Need for a Forensic Investigator
Cyber Crime Investigation
Helps organizations and law enforcement investigate and prosecute cyber crime perpetrators
Sound Evidence Handling
Inexperienced handling can render evidence inadmissible in court
Incident Handling & Response
Helps maintain forensic readiness and implement effective IR teams
00A.11 Roles and Responsibilities of a Forensic Investigator
- 1️⃣ Determines damage during the crime
- 2️⃣ Recovers data of investigative value from computers
- 3️⃣ Gathers evidence in a forensically sound manner
- 4️⃣ Ensures evidence is not damaged
- 5️⃣ Creates images of original evidence without tampering
- 6️⃣ Submits evidence describing discovery procedure
- 7️⃣ Reconstructs damaged disks and uncovers hidden information
- 8️⃣ Analyzes evidence and finds relevant data
- 9️⃣ Prepares proper analysis reports
- 🔟 Updates organization about attack methods and recovery techniques
- 1️⃣1️⃣ Addresses issues in court as testifying witness
- 1️⃣2️⃣ Works to win cases through expert testimony
00A.12 What Makes a Good Computer Forensics Investigator?
- Better interviewing skills
- Researching skills
- Patience and willingness to work long hours
- Excellent writing skills
- Strong analytical skills
- Excellent communication skills
- Up-to-date with new methodologies
- Well versed in multiple platforms (Windows, Mac, Linux)
- Knowledge of hardware & software
- Multi-discipline expertise
- Knowledge of laws surrounding the case
- Perfect accuracy in tests & records
- Ability to control emotions
- Honest, ethical, and law-abiding
- Develops professional contacts
00A.13 Computer Forensics Issues
- Digital evidence is critical and susceptible to changes
- Legal systems differ across jurisdictions
- Different rules for acquiring, preserving & presenting evidence
- Different approaches to authenticity, reliability & completeness
- Legal systems may not address technological advances
- Must be cautious to avoid unlawful search & seizure
- Fourth Amendment: Government agents may not search without warrant
- Private intrusions are exempted from Fourth Amendment
- Must protect other users' anonymity while investigating illegal activities
00A.14 Code of Ethics for Forensic Investigators
- Perform investigations based on well-known standard procedures
- Perform assigned tasks with high commitment and diligence
- Act with ethical and moral principles
- Examine evidence carefully within the scope of the agreement
- Ensure integrity of evidence throughout the investigation
- Act in accordance with federal statutes, state statutes, and local laws
- Testify honestly before any board, court or trial proceedings
- Refuse any evidence that may cause failure in the case
- Expose confidential matters without authorized permission
- Exceed assignments beyond his/her skills
- Perform actions leading to conflict of interest
- Present training, credentials, or membership in a wrong way
- Provide personal or prejudiced opinions
- Reserve any evidence relevant to the case
What is Computer Forensics?
This module introduces the fundamentals of Computer Forensics, a critical discipline within cybersecurity and cybercrime investigations. Computer forensics focuses on the identification, preservation, analysis, and presentation of digital evidence in a legally acceptable manner. By understanding these basics, learners build a strong foundation for digital investigations, incident response, and cyber law enforcement.
Computer forensics = finding, protecting, and explaining digital evidence so it can be used in court.
1.1 Introduction to Computer Forensics
🔍 What is Computer Forensics?
Computer Forensics is the scientific discipline that involves the identification, collection, preservation, analysis, and presentation of digital evidence in a manner that is legally admissible in a court of law.
🎯 Objectives of Computer Forensics
Identify
Recognize digital evidence sourcesPreserve
Maintain evidence integrityAnalyze
Interpret digital evidencePresent
Court-ready documentationReconstruct
Build event timelinesSupport Legal
Admissible evidence📌 Real-World Applications
🚨 Law Enforcement
- Cybercrime investigations (hacking, malware, DDoS)
- Child exploitation cases
- Terrorism and national security
- Homicide and violent crime evidence
🏢 Corporate Investigations
- Insider threat detection (IP theft, data exfiltration)
- Data breach investigations
- Policy violations and HR matters
- Litigation support and eDiscovery
💰 Financial Crimes
- Fraud detection and investigation
- Money laundering tracing
- Embezzlement evidence gathering
- Accounting fraud analysis
🛡️ Incident Response
- Ransomware attack analysis
- Breach containment and eradication
- Root cause identification
- Security improvement recommendations
1.2 History & Evolution of Digital Forensics
🕰️ The Evolution of Digital Forensics
Digital forensics has evolved from simple manual file searches in the 1980s to sophisticated AI-assisted analysis of petabytes of data across cloud, mobile, and IoT devices.
📅 Timeline of Digital Forensics Development
| Era | Key Developments | Notable Tools/Cases |
|---|---|---|
| 1980s (Pioneering Era) |
|
FBI training programs, basic DOS tools |
| 1990s (Formative Era) |
|
SafeBack, DIBS, Expert Witness (EnCase) |
| 2000s (Standardization Era) |
|
FTK, EnCase, Cellebrite, X-Ways |
| 2010s (Expansion Era) |
|
Volatility, Autopsy, Rekall, Oxygen |
| 2020s (AI & Automation Era) |
|
AI-based triage, Automated carving |
🏆 Key Technical Milestones
| Milestone | Description | Impact |
|---|---|---|
| Write Blockers | Development of hardware and software write blockers | Enabled forensic imaging without altering evidence |
| Forensic Image Formats (E01) | Creation of compressed, metadata-rich forensic image formats | Reduced storage requirements while preserving evidence integrity |
| File Carving | Techniques to recover files without metadata | Recovered evidence from formatted or damaged drives |
| Memory Forensics | Analysis of volatile RAM data | Enabled detection of fileless malware and encryption keys |
| Cloud Forensics | Techniques for evidence collection from cloud providers | Addressed challenges of distributed, multi-tenant environments |
1.3 Cyber Crime Categories
🚨 What is Cyber Crime?
Cyber Crime refers to illegal activities conducted using computers, networks, or digital devices as tools, targets, or both. These crimes can affect individuals, organizations, governments, and critical infrastructure.
🗂️ Major Categories of Cyber Crimes
- Identity Theft: Stealing personal information to impersonate someone
- Cyber Stalking: Harassing or threatening individuals online
- Phishing: Tricking users into revealing sensitive information
- Online Scams: Fraudulent schemes targeting victims
- Cyber Bullying: Harassment through digital platforms
- Doxxing: Publishing private information without consent
- Data Breaches: Unauthorized access to sensitive data
- Ransomware: Encrypting data and demanding payment
- Insider Threats: Malicious actions by employees
- Intellectual Property Theft: Stealing trade secrets and patents
- Business Email Compromise (BEC): Fraudulent wire transfers
- DDoS Attacks: Disrupting business operations
- Financial Fraud: Credit card fraud, online banking theft
- Cryptocurrency Theft: Stealing digital currencies
- Copyright Infringement: Unauthorized sharing of copyrighted material
- Software Piracy: Illegal copying and distribution of software
- Digital Vandalism: Defacing websites or destroying data
- Cyber Espionage: Stealing classified information
- Cyber Terrorism: Attacks targeting critical infrastructure
- Election Interference: Manipulating voting systems or public opinion
- Critical Infrastructure Attacks: Power grids, water systems, transportation
📌 Evidence Commonly Found in Cyber Crime Investigations
| Evidence Type | Examples | Where to Find |
|---|---|---|
| 📧 Emails | Headers, attachments, content, metadata | Email servers, Outlook PST files, webmail |
| 🌐 Browser Artifacts | History, cookies, cache, downloads, saved passwords | Chrome/Firefox/Edge profile folders |
| 📁 Deleted Files | Documents, photos, videos, databases | Unallocated space, slack space |
| 📜 Log Files | Authentication, system, application, security | Windows Event Logs, /var/log/ |
| 🔑 Registry | USB history, program execution, user activity | Windows Registry (SAM, SYSTEM, NTUSER.DAT) |
1.4 Role of a Forensic Investigator
🕵️ Who is a Forensic Investigator?
A Forensic Investigator is a trained professional responsible for handling digital evidence during an investigation while ensuring compliance with legal and ethical standards.
🛠️ Key Responsibilities
🔐 Evidence Handling
- Secure and isolate digital devices
- Collect and preserve evidence forensically
- Maintain chain of custody documentation
- Use write blockers and forensic tools
🔍 Analysis & Examination
- Perform forensic analysis on images
- Recover deleted files and artifacts
- Reconstruct timelines of events
- Correlate evidence across sources
📄 Documentation & Reporting
- Document all actions and findings
- Prepare court-ready forensic reports
- Create evidence exhibits
- Peer review findings
⚖️ Legal Support
- Present evidence in court as expert witness
- Explain technical concepts to juries
- Defend methodology and tool selection
- Maintain neutrality and professionalism
🎓 Required Skills & Competencies
- Operating systems (Windows, Linux, macOS)
- File systems (NTFS, FAT, EXT, APFS)
- Forensic tools (FTK, EnCase, Autopsy)
- Memory forensics (Volatility)
- Network analysis (Wireshark)
- Mobile forensics (Cellebrite, Oxygen)
- Scripting (Python, PowerShell)
- Attention to detail
- Critical thinking and problem-solving
- Written and verbal communication
- Courtroom testimony and presentation
- Ethical judgment and integrity
- Project management
- Continuous learning mindset
- CHFI (EC-Council)
- GCFE / GCFA (SANS)
- EnCE (OpenText)
- CCFE (ISFCE)
- Cellebrite CCE
- CCFP (ISC)²
1.5 Legal Importance of Digital Evidence
⚖️ Why Legal Compliance Matters
Digital evidence must be handled carefully to ensure it remains admissible in court. Improper handling can result in evidence being rejected, potentially destroying an entire investigation.
📜 Legal Principles in Digital Forensics
Integrity
Evidence must not be alteredAuthenticity
Proof of originalityChain of Custody
Complete documentationRepeatability
Results must be reproducible📂 Chain of Custody - Complete Example
| Stage | Action | Documentation Required |
|---|---|---|
| Collection | Device seized and documented | Evidence ID, location, time, collector name |
| Transport | Evidence transferred to lab | Transfer logs, signatures, timestamps |
| Storage | Secured in evidence locker | Access logs, locker number, seal status |
| Analysis | Forensic examination performed | Examiner name, date, tools used, hash values |
| Return/Presentation | Evidence returned or presented in court | Final disposition, court exhibit logs |
⚖️ Admissibility Standards (Daubert vs Frye)
Judge acts as gatekeeper; considers:
- Methodology has been tested
- Peer-reviewed and published
- Known or potential error rate
- Generally accepted in scientific community
Evidence must be:
- "Generally accepted" in the relevant scientific community
- Less rigorous than Daubert
- Still used in California, New York, and other states
Digital forensics is not just technical — it is legal science. Every action must be documented, repeatable, and defensible in court.
🎓 Module 01 : What is Computer Forensics Successfully Completed
You have successfully completed this module of Cyber Forensics Investigation.
Keep building your expertise step by step — Learn Next Module →
Methods by which a Computer Gets Hacked
This module explains the common techniques attackers use to compromise computers. Understanding how systems are hacked is essential for computer forensics professionals, as it helps identify attack traces, evidence artifacts, and indicators of compromise (IoCs). By the end of this module, you will be able to recognize attack patterns, understand attacker behavior, and support forensic investigations effectively.
To investigate an attack, you must first understand how the attack happens.
2.1 Malware-Based Attacks
🦠 What is Malware?
Malware (Malicious Software) is any program intentionally designed to damage, disrupt, spy on, or gain unauthorized access to a computer system. Malware is one of the most common ways computers get hacked.
🧬 Types of Malware
- Virus – Attaches to files and spreads when executed
- Worm – Self-replicates across networks
- Trojan Horse – Disguised as legitimate software
- Ransomware – Encrypts data and demands payment
- Spyware – Secretly monitors user activity
- Keylogger – Records keystrokes
🔍 How Malware Enters a System
- Malicious email attachments
- Cracked or pirated software
- Infected USB drives
- Malicious websites
2.2 Network-Based Intrusions
🌐 What is a Network Intrusion?
A network-based intrusion occurs when an attacker gains access to a computer by exploiting network vulnerabilities such as open ports, weak services, or misconfigured devices.
📡 Common Network Attack Methods
- Exploiting open ports
- Weak or default credentials
- Unpatched services
- Man-in-the-Middle (MITM) attacks
- Remote service abuse (RDP, SSH)
📂 Forensic Evidence in Network Attacks
- Firewall logs
- Authentication logs
- Unusual login times
- Unknown remote connections
2.3 Phishing & Social Engineering
🎣 What is Phishing?
Phishing is a social engineering attack where attackers trick users into revealing sensitive information such as passwords, banking details, or login credentials.
🧠 Why Social Engineering Works
- Human trust
- Fear and urgency
- Authority impersonation
- Lack of security awareness
📨 Common Phishing Techniques
- Email phishing
- SMS phishing (Smishing)
- Voice phishing (Vishing)
- Fake login pages
2.4 Insider Threats
👤 What is an Insider Threat?
An insider threat occurs when a trusted individual (employee, contractor, or partner) misuses their authorized access to harm an organization.
📌 Types of Insider Threats
- Malicious insiders
- Negligent insiders
- Compromised insiders
🔍 Insider Attack Indicators
- Unusual file access
- Large data transfers
- Access outside work hours
- Use of unauthorized devices
2.5 Indicators of Compromise (IoCs)
🚩 What are Indicators of Compromise?
Indicators of Compromise (IoCs) are digital signs that indicate a system may have been hacked or compromised.
📊 Common IoCs
| Category | Examples |
|---|---|
| File-Based | Unknown executables, modified system files |
| Network-Based | Suspicious IP connections, unusual traffic |
| Log-Based | Repeated failed logins, privilege escalation |
| User Behavior | Unexpected account activity |
🧠 Why IoCs Matter in Forensics
- Help confirm a security breach
- Assist in timeline reconstruction
- Support incident response decisions
- Provide court-admissible evidence
Understanding attack methods helps forensic investigators identify evidence faster and more accurately.
2.6 HTTP protocol overview (attack surface)
🌐 What is HTTP?
The Hypertext Transfer Protocol (HTTP) is a set of rules that defines how data is exchanged between a client (such as a web browser or mobile app) and a server (such as a website or web application). Every time a user opens a website, submits a form, or logs into an application, HTTP is used to send and receive information.
HTTP works on a request–response model:
- The client sends an HTTP request to the server
- The server processes the request
- The server sends back an HTTP response
Almost all modern web-based attacks exploit HTTP behavior, misconfiguration, or incorrect trust assumptions, which is why HTTP is critical for forensic investigators to understand.
📨 HTTP Request Methods (HTTP Verbs)
HTTP defines a set of request methods (also called HTTP verbs) that describe what action the client wants the server to perform. Each method has a specific meaning and expected behavior.
| Method | Purpose (Simple Meaning) | Forensic / Security Relevance |
|---|---|---|
| GET | Request data from the server | Reconnaissance, data harvesting |
| HEAD | Request headers only (no content) | Service probing, resource discovery |
| POST | Send data to the server | Credential submission, injections |
| PUT | Replace an existing resource | Unauthorized file or data overwrite |
| DELETE | Remove a resource | Data deletion attempts |
| PATCH | Modify part of a resource | Unauthorized changes |
| OPTIONS | Ask server what methods are allowed | Method enumeration |
| TRACE | Echo request for testing | Information disclosure risk |
| CONNECT | Create a tunnel (usually HTTPS) | Proxy and tunneling abuse |
🧠 Safe, Idempotent & Cacheable Methods (Easy Explanation)
HTTP methods are categorized based on how they behave. These properties are extremely important in both security monitoring and forensic investigations.
🟢 Safe Methods
Safe methods are intended to only retrieve data and should not change anything on the server.
- GET
- HEAD
- OPTIONS
- TRACE
🔁 Idempotent Methods
A method is idempotent if sending the same request multiple times results in the same outcome.
- GET
- HEAD
- OPTIONS
- TRACE
- PUT
- DELETE
📦 Cacheable Methods
Cacheable methods allow responses to be stored and reused to improve performance.
- GET
- HEAD
- POST / PATCH (only under specific conditions)
🧠 Why HTTP is a Major Attack Surface
- HTTP is publicly accessible over the internet
- User input is directly sent in requests
- HTTP is stateless, relying on sessions and cookies
- Improper validation leads to misuse and abuse
- Misused methods can change or destroy data
| Method | Desktop Browsers | Mobile / Embedded | ||||||||||
|---|---|---|---|---|---|---|---|---|---|---|---|---|
| Chrome | Edge | Firefox | Opera | Safari | Chrome Android |
Firefox Android |
Opera Android |
Safari iOS |
Samsung Internet |
WebView Android |
WebView iOS |
|
| CONNECT | ✔1 | ✔12 | ✔1 | ✔15 | ✔1 | ✔18 | ✔4 | ✔14 | ✔1 | ✔1 | ✔4.4 | ✔1 |
| DELETE | ✔1 | ✔12 | ✔1 | ✔15 | ✔1 | ✔18 | ✔4 | ✔14 | ✔1 | ✔1 | ✔4.4 | ✔1 |
| GET | ✔1 | ✔12 | ✔1 | ✔2 | ✔1 | ✔18 | ✔4 | ✔10.1 | ✔1 | ✔1 | ✔1 | ✔1 |
| HEAD | ✔1 | ✔12 | ✔1 | ✔15 | ✔1 | ✔18 | ✔4 | ✔14 | ✔1 | ✔1 | ✔4.4 | ✔1 |
| OPTIONS | ✔1 | ✔12 | ✔1 | ✔15 | ✔1 | ✔18 | ✔4 | ✔14 | ✔1 | ✔1 | ✔4.4 | ✔1 |
| POST | ✔1 | ✔12 | ✔1 | ✔15 | ✔1 | ✔18 | ✔4 | ✔14 | ✔1 | ✔1 | ✔4.4 | ✔1 |
| PUT | ✔1 | ✔12 | ✔1 | ✔15 | ✔1 | ✔18 | ✔4 | ✔14 | ✔1 | ✔1 | ✔4.4 | ✔1 |
Every HTTP request produces evidence such as:
- Request method
- Headers
- IP address
- Timestamps
- Status codes
2.7 HTTP Request Methods & Misuse
📨 Understanding HTTP Request Methods
HTTP request methods (also called HTTP verbs) define what action a client wants the server to perform. Each method has a specific purpose and expected behavior. When methods are used outside their intended purpose, they can become powerful attack vectors.
From a forensic perspective, the method used in a request is often the first indicator of attacker intent.
📋 Common HTTP Methods & Intended Use
| Method | Intended Function | Normal Usage Example |
|---|---|---|
| GET | Retrieve data | Viewing a webpage |
| HEAD | Retrieve headers only | Checking resource existence |
| POST | Submit data | Login forms, uploads |
| PUT | Replace a resource | Updating stored data |
| PATCH | Modify part of a resource | Profile updates |
| DELETE | Remove a resource | Deleting records |
| OPTIONS | Query allowed methods | Preflight checks |
| TRACE | Loop-back testing | Debugging |
| CONNECT | Create a tunnel | HTTPS via proxy |
🚩 How HTTP Methods Are Misused
Attackers often misuse HTTP methods by invoking them in contexts where they should not be allowed. This misuse does not require breaking encryption— it relies on server-side trust failures.
- Using GET to send sensitive data via URL parameters
- Abusing POST to submit manipulated input
- Invoking PUT or DELETE without authorization
- Using OPTIONS to discover enabled methods
- Triggering TRACE to expose request data
- Misusing CONNECT for tunneling traffic
Most method misuse occurs due to improper access control, not because the method itself is insecure.
🔍 Forensic Indicators of Method Misuse
During investigations, method misuse is detected by analyzing patterns in logs rather than single requests.
- Presence of rarely used methods (PUT, DELETE, TRACE)
- Unsafe methods used by unauthenticated users
- Methods used at unusual times
- Repeated method attempts on multiple resources
- Method–response mismatches (e.g., DELETE + 200)
🧠 Why Method Misuse Matters in Forensics
- Helps identify attacker intent
- Distinguishes probing from exploitation
- Supports timeline reconstruction
- Links actions to user accounts or IP addresses
- Strengthens courtroom explanations
HTTP methods, when correlated with timestamps, authentication state, and response codes, form a reliable narrative of attacker behavior.
2.8 Safe vs Unsafe HTTP Methods
⚖️ What Does “Safe” and “Unsafe” Mean in HTTP?
In HTTP terminology, the words safe and unsafe do not describe whether a method is secure or insecure. Instead, they describe whether a request is expected to change server-side data or system state.
This distinction is critical in both security design and forensic investigations, because unsafe methods directly modify data and therefore leave stronger and more legally significant evidence.
🟢 Safe HTTP Methods
Safe methods are intended only to retrieve information. They should not create, modify, or delete data on the server.
| Method | Expected Behavior | Typical Usage | Forensic Relevance |
|---|---|---|---|
| GET | Read-only data access | Viewing pages, fetching resources | Reconnaissance, data exposure checks |
| HEAD | Metadata retrieval only | Checking file existence | Resource enumeration |
| OPTIONS | Query allowed methods | CORS preflight | Method discovery |
| TRACE | Echo request back | Diagnostics | Header leakage detection |
Safe methods can still be abused if they expose sensitive data, but they are not intended to change server state.
🔴 Unsafe HTTP Methods
Unsafe methods are designed to change server-side data or system state. These methods are high-risk and must always be protected by authentication and authorization controls.
| Method | Expected Action | Normal Use Case | Attack Risk |
|---|---|---|---|
| POST | Create or process data | Logins, form submissions | Injection, credential abuse |
| PUT | Replace a resource | Updating stored objects | Unauthorized overwrites |
| PATCH | Partial modification | Profile updates | Privilege escalation |
| DELETE | Remove data | Record deletion | Data destruction |
| CONNECT | Create network tunnel | HTTPS via proxy | Tunneling & C2 traffic |
Unsafe methods must never be accessible without proper authorization checks. Most real-world breaches occur when these checks are missing or flawed.
🚨 Common Abuse Scenarios (Attack Perspective)
- DELETE requests issued by non-admin users
- PUT requests overwriting application files
- POST requests injecting malicious payloads
- CONNECT requests creating hidden tunnels
- PATCH requests modifying restricted attributes
🔍 Forensic Indicators of Unsafe Method Abuse
Investigators look for patterns that indicate unsafe methods are being abused rather than legitimately used.
- Unsafe methods from unauthenticated sessions
- DELETE or PUT requests outside business hours
- Repeated POST requests with abnormal payload sizes
- CONNECT requests from web applications (unusual)
- Mismatch between user role and method used
🧠 Why Safe vs Unsafe Matters in Court
- Unsafe methods demonstrate intent to modify or destroy
- They help prove impact and damage
- They support differentiation between browsing and exploitation
- They strengthen attribution of malicious activity
Safe methods show what an attacker looked at. Unsafe methods show what an attacker did. This distinction is crucial for forensic reconstruction and legal accountability.
2.9 Idempotent HTTP Methods & Replay Risks
🔁 What Does “Idempotent” Mean in HTTP?
In HTTP, a request method is called idempotent if performing the same request multiple times results in the same final state on the server.
In simple terms:
- Sending the request once or ten times has the same effect
- No additional damage or change should occur
Idempotent does not mean safe. It only describes how repeated requests behave.
📋 Idempotent vs Non-Idempotent Methods
| Method | Idempotent? | Reason | Forensic Meaning |
|---|---|---|---|
| GET | Yes | Read-only retrieval | Repeated access attempts |
| HEAD | Yes | No data modification | Probing without content |
| OPTIONS | Yes | Query-only operation | Method discovery patterns |
| TRACE | Yes | Diagnostic echo | Information exposure attempts |
| PUT | Yes | Replaces resource fully | Overwrite attempts |
| DELETE | Yes | Deletes once, stays deleted | Data destruction evidence |
| POST | No | Creates new state each time | Replay-sensitive actions |
| PATCH | No | Partial unpredictable updates | Incremental abuse |
| CONNECT | No | Creates new tunnel | Repeated tunneling |
🔄 What Is an HTTP Replay Attack?
A replay attack occurs when an attacker captures a legitimate HTTP request and re-sends it multiple times to cause unauthorized or repeated effects.
Replay attacks are especially dangerous when:
- Requests lack timestamps or nonces
- Authentication tokens remain valid
- Requests trigger financial or state-changing actions
Even perfectly valid requests can become malicious when replayed out of context.
🚨 Replay Risks by HTTP Method
| Method | Replay Impact | Example Risk |
|---|---|---|
| GET | Low | Repeated data harvesting |
| PUT | Medium | Repeated overwrites | DELETE | Medium | Confirmation of deletion |
| POST | High | Duplicate transactions |
| PATCH | High | Multiple incremental changes |
| CONNECT | High | Multiple covert tunnels |
🔍 Forensic Indicators of Replay Attacks
Replay attacks are identified by patterns over time, not by a single request.
- Identical requests repeated with same parameters
- Same authentication token reused
- Repeated requests within abnormal time intervals
- Multiple identical responses with same status code
- Duplicate actions in application logs
🧠 Why Idempotency Matters in Forensics
- Helps distinguish accidental retries from attacks
- Explains repeated effects in system timelines
- Supports intent analysis
- Clarifies impact magnitude
- Strengthens expert testimony
Idempotent methods define how systems should behave. Replay attacks reveal how systems actually behave under abuse. Understanding both is essential for accurate forensic reconstruction.
2.10 HTTP Response Status Codes & Attack Indicators
📬 What Are HTTP Response Status Codes?
HTTP response status codes are three-digit numbers sent by the server to indicate the outcome of a client’s request. They communicate whether a request was successful, failed, redirected, or blocked.
For forensic investigators, status codes are not just technical responses — they are behavioral signals that reveal how an application reacted to each action.
The same request with different status codes often indicates probing, privilege escalation attempts, or security controls in action.
📊 HTTP Status Code Categories
| Category | Range | Meaning | Forensic Significance |
|---|---|---|---|
| 1xx | 100–199 | Informational | Rare in attacks, protocol-level behavior |
| 2xx | 200–299 | Success | Confirmed action execution |
| 3xx | 300–399 | Redirection | Authentication flow tracing |
| 4xx | 400–499 | Client error | Attack attempts & probing |
| 5xx | 500–599 | Server error | Exploitation impact evidence |
🟢 2xx – Success Codes (Action Confirmed)
2xx status codes indicate that the server accepted and processed the request successfully. In forensic investigations, this often confirms that an action actually occurred.
| Code | Meaning | Attack Indicator |
|---|---|---|
| 200 OK | Request succeeded | Successful exploitation |
| 201 Created | Resource created | Unauthorized object creation |
| 204 No Content | Success without response body | Silent data modification |
A 2xx response after an unsafe method is often direct proof of impact.
🔁 3xx – Redirection Codes (Flow Analysis)
3xx responses instruct the client to take another action, usually by redirecting to a different URL. These are critical for tracing authentication and session workflows.
| Code | Meaning | Forensic Use |
|---|---|---|
| 301 | Moved permanently | Legacy endpoint mapping |
| 302 | Temporary redirect | Login flow tracking |
| 307 | Temporary redirect (method preserved) | Method replay tracing |
🚫 4xx – Client Error Codes (Attack Attempts)
4xx status codes occur when the client sends a request that the server cannot or will not process. In attack scenarios, these codes often appear during probing.
| Code | Meaning | Attack Indicator |
|---|---|---|
| 400 | Bad Request | Malformed payloads |
| 401 | Unauthorized | Credential guessing |
| 403 | Forbidden | Privilege escalation attempt |
| 404 | Not Found | Resource enumeration |
| 429 | Too Many Requests | Brute-force activity |
Repeated 4xx responses followed by a 2xx often indicate a successful attack sequence.
🔥 5xx – Server Error Codes (Exploitation Evidence)
5xx errors indicate that the server failed while processing a request. These are strong indicators of vulnerability exploitation attempts.
| Code | Meaning | Forensic Interpretation |
|---|---|---|
| 500 | Internal Server Error | Unhandled input or crash |
| 502 | Bad Gateway | Backend service failure |
| 503 | Service Unavailable | Denial-of-service indicator |
🔍 Correlating Status Codes for Attack Detection
- 401 → 403 → 200 : privilege escalation
- 404 scanning followed by 200 : resource discovery
- Multiple 500 errors : exploitation testing
- 429 responses : automated attack detection
- Repeated 3xx loops : authentication bypass attempts
🧠 Why Status Codes Matter in Court
- They objectively prove request outcomes
- They show server-side decisions
- They help demonstrate attacker intent
- They support timeline reconstruction
- They strengthen expert testimony
HTTP status codes are the language servers use to describe events. Investigators who understand this language can reconstruct attacks with accuracy and confidence.
2.11 HTTP Headers Abuse & Manipulation
📦 What Are HTTP Headers?
HTTP headers are key–value pairs sent along with HTTP requests and responses. They provide metadata about the request, the client, the server, and the data being exchanged.
Headers are trusted by many applications to make decisions about authentication, routing, content handling, and security controls — which makes them a high-value attack surface.
Headers often reveal who sent the request, how it was sent, and what the attacker tried to influence.
📋 Common HTTP Headers & Their Purpose
| Header | Normal Purpose | Why It Matters |
|---|---|---|
| Host | Target domain name | Routing & virtual hosting |
| User-Agent | Client identification | Device & tool fingerprinting |
| Referer | Previous page | Navigation flow tracking |
| Authorization | Authentication credentials | Access control enforcement |
| Cookie | Session state | User identity & persistence |
| X-Forwarded-For | Original client IP | IP trust decisions |
| Content-Type | Payload format | Input parsing logic |
🚨 Why HTTP Headers Are Frequently Abused
- Headers are client-controlled
- Applications often trust headers blindly
- Security decisions rely on header values
- Headers are rarely validated properly
- Manipulation does not break encryption
Any header sent by a client should be considered untrusted input.
🧪 Common Header Abuse Techniques
| Header | Abuse Pattern | Attack Objective |
|---|---|---|
| Host | Fake domain injection | Cache poisoning, routing abuse |
| User-Agent | Spoofing browser identity | Bypass filters, evade detection |
| Referer | Forged navigation source | CSRF bypass, logic abuse |
| X-Forwarded-For | Forged internal IP | IP-based trust bypass |
| Authorization | Token reuse or manipulation | Privilege escalation |
| Content-Type | Mismatched format | Parser confusion |
🔍 Forensic Indicators of Header Manipulation
Header abuse is rarely visible in a single request. Investigators identify it through pattern analysis.
- User-Agent strings inconsistent with browser behavior
- X-Forwarded-For showing private or internal IP ranges
- Host headers not matching requested domain
- Authorization headers reused across IPs
- Referer values that break navigation logic
🧠 Header Manipulation in Attack Timelines
- Initial probing uses altered User-Agent
- Enumeration uses manipulated Host headers
- Exploitation uses forged Authorization or cookies
- Persistence uses consistent spoofed headers
⚖️ Legal & Evidentiary Importance
- Headers prove request origin claims
- They link activity across sessions
- They expose intent to bypass controls
- They help attribute automated tools
- They are court-admissible log evidence
HTTP headers are the fingerprints of web requests. When attackers manipulate headers, they leave behind patterns that forensic investigators can reliably trace and explain in court.
2.12 Authentication, Sessions & Cookies
🔐 What Is Authentication?
Authentication is the process of verifying who a user is. In web applications, authentication is typically performed using credentials such as usernames, passwords, tokens, or certificates.
Once authentication succeeds, the server must remember the user — this is where sessions and cookies come into play.
Authentication events are among the most legally significant artifacts because they directly associate actions with identities.
🧩 Authentication Methods Used on the Web
| Method | Description | Forensic Relevance |
|---|---|---|
| Username & Password | Traditional credential-based login | Password guessing & credential reuse |
| Session Cookies | Server-issued session identifier | Session hijacking evidence |
| Token-Based (JWT, API keys) | Stateless authentication tokens | Token theft & replay analysis |
| Multi-Factor Authentication | Additional verification factor | Bypass attempt detection |
🧠 What Is a Session?
HTTP is stateless, meaning it does not remember previous requests. A session is a mechanism that allows a server to associate multiple requests with the same authenticated user.
Sessions are usually identified by a unique session ID, which is stored on the client side and sent with each request.
- Session ID is generated after login
- Stored in a cookie or token
- Sent automatically with each request
🍪 What Are Cookies?
Cookies are small pieces of data stored in the client’s browser and sent back to the server with each HTTP request.
Cookies are commonly used to store:
- Session identifiers
- Authentication state
- User preferences
- Tracking information
| Cookie Attribute | Purpose | Security Impact |
|---|---|---|
| Secure | Send cookie only over HTTPS | Prevents network sniffing |
| HttpOnly | Block JavaScript access | Reduces XSS impact |
| SameSite | Restrict cross-site sending | CSRF protection |
| Expiration | Session lifetime | Persistence control |
🚨 Common Attacks Against Authentication & Sessions
- Credential stuffing
- Password brute force
- Session hijacking
- Session fixation
- Token replay attacks
- Cookie theft via XSS
Most successful web attacks do not break encryption — they steal or reuse valid authentication artifacts.
🔍 Forensic Indicators of Authentication Abuse
Authentication abuse is detected by correlating logs across multiple layers.
- Multiple login attempts followed by success
- Same session ID used from different IPs
- Token reuse across devices
- Access without login event
- Session activity outside normal time windows
🧠 Sessions & Cookies in Attack Timelines
- Initial access through stolen credentials
- Session established and reused
- Privilege escalation using same session
- Lateral movement using persistent cookies
- Cleanup or logout to hide activity
⚖️ Legal & Evidentiary Importance
- Links actions to authenticated identities
- Demonstrates unauthorized access
- Supports intent and persistence
- Correlates user behavior across time
- Provides strong courtroom evidence
Authentication proves who accessed the system. Sessions show how long they stayed. Cookies reveal how access was maintained. Together, they form the backbone of web forensic investigations.
2.13 Web Logs & Forensic Evidence
📄 What Are Web Logs?
Web logs are structured records automatically generated by web servers, applications, proxies, and security devices. They document every request, response, and system interaction that occurs during web communication.
From a forensic perspective, web logs form the primary source of truth for reconstructing web-based attacks.
Unlike volatile memory, logs persist over time and provide a chronological narrative of attacker behavior.
📂 Types of Web Logs
| Log Type | Description | Forensic Value |
|---|---|---|
| Access Logs | Record incoming HTTP requests | Tracks attacker actions |
| Error Logs | Application and server failures | Evidence of exploitation |
| Application Logs | Business logic events | User activity correlation |
| Authentication Logs | Login and logout events | Identity attribution |
| Proxy / WAF Logs | Traffic inspection data | Attack detection confirmation |
🧩 Key Data Elements in Web Logs
Effective forensic analysis depends on identifying and correlating specific log fields.
| Log Field | Description | Why It Matters |
|---|---|---|
| Timestamp | Date & time of request | Timeline reconstruction |
| Client IP | Source address | Attribution & geolocation |
| HTTP Method | Action requested | Intent identification |
| URL / Endpoint | Targeted resource | Attack surface mapping |
| Status Code | Server response | Outcome validation |
| User-Agent | Client identity | Tool fingerprinting |
| Session ID / Cookie | User continuity | Session hijacking detection |
🔗 Correlating Logs Across Systems
A single log source rarely tells the full story. Investigators must correlate multiple log types to build a complete attack narrative.
- Web server logs show raw HTTP activity
- Application logs explain business logic impact
- Authentication logs confirm identity usage
- WAF logs show blocked or flagged requests
- Network logs confirm traffic flow
🚨 Common Attack Patterns Found in Logs
| Pattern | Log Behavior | Interpretation |
|---|---|---|
| Scanning | Many 404s across URLs | Reconnaissance |
| Brute Force | Repeated 401/403 | Credential attack |
| Exploitation | 500 errors followed by 200 | Successful exploit |
| Session Hijack | Same session ID, different IPs | Cookie theft |
| Automation | Uniform User-Agent | Scripted attack |
🧠 Building an Attack Timeline
- Initial access (probing & scanning)
- Authentication attempts
- Successful session establishment
- Privilege escalation or data access
- Persistence and lateral movement
- Cleanup or log tampering attempts
⚖️ Legal & Evidentiary Considerations
- Logs must maintain integrity
- Time synchronization is critical
- Chain of custody applies to logs
- Original logs are preferred over exports
- Correlation methodology must be explainable
Missing logs do not mean no attack — they may indicate deliberate log deletion or evasion.
🧠 Why Web Logs Are Powerful Evidence
- They objectively record events
- They demonstrate intent and impact
- They link actions across systems
- They support expert testimony
- They withstand legal scrutiny
Web logs transform isolated HTTP requests into a coherent, provable attack narrative. Mastery of log analysis is essential for professional computer forensic investigations.
2.14 DNS Fundamentals & Attack Surface
🌐 What Is DNS?
The Domain Name System (DNS) is a hierarchical
naming system that translates
human-readable domain names
(such as example.com)
into machine-readable IP addresses.
DNS acts as the internet’s phonebook. Without DNS, users would need to remember IP addresses instead of domain names.
Almost every web, email, malware, and phishing activity begins with a DNS query. DNS evidence often appears before HTTP or TLS evidence.
🔁 How DNS Resolution Works (Step-by-Step)
DNS resolution follows a predictable sequence, which is essential for forensic reconstruction.
- User enters a domain name in a browser or application
- Local cache is checked (browser / OS)
- Request sent to a recursive DNS resolver
- Resolver queries root DNS servers
- Root points to TLD servers (e.g., .com, .org)
- TLD points to authoritative name server
- Authoritative server returns the IP address
Each step leaves potential forensic artifacts in system logs, network logs, or DNS resolver logs.
🏗️ DNS Architecture Components
| Component | Role | Forensic Importance |
|---|---|---|
| DNS Client | Initiates DNS query | User activity attribution |
| Recursive Resolver | Performs lookup on behalf of client | Centralized query logging |
| Root Servers | Direct to TLD servers | Global resolution flow |
| TLD Servers | Manage top-level domains | Domain ownership context |
| Authoritative Server | Provides final DNS answer | Direct attacker infrastructure evidence |
🎯 Why DNS Is a Major Attack Surface
- DNS is unauthenticated by default
- Queries are often unencrypted
- Applications blindly trust DNS responses
- DNS controls traffic direction
- Malware relies heavily on DNS
If an attacker controls DNS, they effectively control where users and systems connect.
🚨 Common DNS-Based Attack Techniques
| Attack Type | Description | Forensic Indicator |
|---|---|---|
| DNS Spoofing | Fake DNS responses | Unexpected IP resolution |
| DNS Poisoning | Cache manipulation | Multiple users affected |
| Phishing Domains | Malicious look-alike domains | Recently registered domains |
| Fast Flux | Rapid IP changes | Short TTL values |
| DNS Tunneling | Data exfiltration via DNS | Unusually long domain queries |
🔍 Forensic Indicators in DNS Logs
- High volume of failed DNS queries
- Queries to newly registered domains
- Frequent subdomain lookups
- Suspicious top-level domains
- DNS activity outside business hours
🧠 DNS in Attack Timelines
- Reconnaissance via domain discovery
- Initial access through malicious domains
- Command-and-control resolution
- Data exfiltration via DNS tunneling
- Persistence using rotating domains
⚖️ Legal & Evidentiary Importance of DNS
- Links malware to infrastructure
- Establishes attacker control
- Supports attribution analysis
- Correlates network and application logs
- Often admissible as objective evidence
DNS is the invisible foundation of cyber attacks. Forensic investigators who understand DNS can trace attacks back to their infrastructure, even when higher-layer evidence is missing.
2.15 Domain & Subdomain Enumeration
🌍 What Is a Domain?
A domain name is a human-readable identifier
that represents an internet resource, such as a website,
mail server, or application endpoint.
Examples include example.com or bank.gov.
Domains form the identity layer of the internet, mapping services, ownership, and infrastructure to names.
Domains often reveal ownership, hosting providers, geographic regions, and attacker infrastructure relationships.
🌐 What Is a Subdomain?
A subdomain is a child domain that exists under a primary domain. For example:
www.example.commail.example.comadmin.example.com
Each subdomain may point to a different server, application, or service.
Subdomains are frequently forgotten, misconfigured, or poorly monitored — making them prime attack targets.
🔎 What Is Domain & Subdomain Enumeration?
Domain and subdomain enumeration is the process of identifying all domains and subdomains associated with an organization or attacker-controlled infrastructure.
In forensics, enumeration is used to:
- Define the scope of compromise
- Discover hidden or legacy services
- Identify attacker command-and-control endpoints
- Link multiple incidents to the same infrastructure
🏗️ Why Enumeration Is a Major Attack Surface
- Every subdomain expands the attack surface
- Old subdomains may point to abandoned services
- Misconfigured DNS records expose internal systems
- Attackers reuse domains across campaigns
- Certificate transparency leaks subdomain data
A single forgotten subdomain can undermine the security of an entire organization.
🚨 Common Enumeration Abuse Scenarios
| Scenario | Description | Forensic Indicator |
|---|---|---|
| Shadow IT | Unknown subdomains hosting services | No logging or monitoring |
| Phishing Infrastructure | Look-alike subdomains | Recently registered domains |
| Abandoned Services | Old subdomains still resolving | Unmaintained IP addresses |
| C2 Endpoints | Subdomains for malware control | Irregular DNS patterns |
🔍 Forensic Indicators from Domains & Subdomains
- Domains registered shortly before an incident
- High number of dynamically generated subdomains
- Domains with short registration periods
- Subdomains pointing to multiple IPs
- Reuse of domains across multiple attacks
🧠 Domain & Subdomain Enumeration in Attack Timelines
- Reconnaissance through domain discovery
- Infrastructure setup using new subdomains
- Initial access via malicious domains
- Persistence through rotating subdomains
- Cleanup by abandoning domains
⚖️ Legal & Evidentiary Importance
- Helps attribute attacks to infrastructure owners
- Establishes scope of affected assets
- Links multiple incidents together
- Supports expert testimony on attacker behavior
- Provides objective, verifiable evidence
Domains define identity. Subdomains define scope. Enumeration allows forensic investigators to map attacker infrastructure and uncover hidden attack paths.
2.16 DNS Records & Forensic Relevance
📘 What Are DNS Records?
DNS records are structured entries stored on DNS servers that define how a domain behaves and where its services are located. They act as the instruction set of the internet, translating domain names into technical destinations.
Every website visit, email delivery, or API call depends on DNS records to function correctly.
DNS records persist longer than application logs and often reveal attacker infrastructure even after cleanup.
🧩 Why DNS Records Matter in Cyber Attacks
- Attackers must register and configure DNS to operate
- Malware relies on DNS for command-and-control
- Phishing depends on DNS resolution
- DNS records expose hosting relationships
- Changes in DNS often precede attacks
📂 Common DNS Record Types (With Forensic Meaning)
| Record Type | Purpose | Forensic Relevance |
|---|---|---|
| A | Maps domain to IPv4 address | Identifies hosting servers |
| AAAA | Maps domain to IPv6 address | Hidden infrastructure paths |
| CNAME | Alias to another domain | Infrastructure chaining |
| MX | Mail server routing | Email phishing infrastructure |
| TXT | Text-based metadata | SPF, DKIM, attacker notes |
| NS | Authoritative name servers | Control & ownership evidence |
| SOA | Zone authority info | Change timelines |
🧪 Deep Dive: Forensic Value of Key DNS Records
📌 A & AAAA Records
- Reveal hosting IP addresses
- Expose cloud provider usage
- Enable correlation across domains
- Show infrastructure reuse
📌 CNAME Records
- Chain attacker infrastructure
- Hide true hosting locations
- Reveal redirection techniques
- Expose shared backend services
📌 MX Records
- Identify phishing mail servers
- Trace spam campaigns
- Link email attacks to domains
- Expose spoofing weaknesses
📌 TXT Records
- SPF misconfigurations
- DKIM verification failures
- Attacker operational notes
- Malware configuration storage
🚨 DNS Abuse Patterns Seen in Attacks
- Fast Flux DNS (rapid IP rotation)
- Domain Generation Algorithms (DGA)
- Short-lived DNS records
- Suspicious TTL values
- DNS tunneling via TXT queries
🕒 DNS Records in Timeline Reconstruction
- Domain registration time
- DNS record creation timestamps
- IP changes during attack phases
- Infrastructure migration evidence
- Post-incident abandonment patterns
🔍 DNS Logs as Forensic Evidence
- Query logs from resolvers
- Passive DNS databases
- ISP DNS telemetry
- Enterprise DNS security tools
⚖️ Legal & Investigative Importance
- Supports attribution claims
- Links multiple incidents
- Correlates attacker infrastructure
- Provides objective, third-party evidence
- Accepted in court as technical proof
DNS records are the backbone of attacker infrastructure. Understanding them allows forensic investigators to uncover hidden relationships, reconstruct attack timelines, and attribute malicious activity with confidence.
2.17 SSL / TLS Fundamentals
🔐 What Are SSL and TLS?
SSL (Secure Sockets Layer) and its successor TLS (Transport Layer Security) are cryptographic protocols designed to provide secure communication over insecure networks.
Today, TLS is used in nearly all secure internet communications, including HTTPS, secure email, APIs, VPNs, and cloud services.
📜 Why SSL Was Replaced by TLS
- SSL contained cryptographic weaknesses
- TLS introduced stronger algorithms
- Improved handshake security
- Better resistance to downgrade attacks
- Wider support for modern cryptography
🔄 How TLS Works (High-Level Flow)
- Client initiates a secure connection
- Server presents a digital certificate
- Certificate authenticity is verified
- Encryption parameters are negotiated
- Secure, encrypted data exchange begins
🧩 Core TLS Components
| Component | Purpose | Forensic Relevance |
|---|---|---|
| Certificates | Identity verification | Domain attribution |
| Public/Private Keys | Encryption & key exchange | Key misuse detection |
| Cipher Suites | Encryption algorithms | Weak crypto detection |
| Handshake | Secure setup | Metadata extraction |
📜 TLS Versions & Security Status
| Version | Status | Forensic Implication |
|---|---|---|
| SSLv2 / SSLv3 | Insecure | Misconfiguration evidence |
| TLS 1.0 | Deprecated | Legacy system exposure |
| TLS 1.1 | Deprecated | Weak compliance |
| TLS 1.2 | Secure | Standard enterprise usage |
| TLS 1.3 | Highly Secure | Reduced metadata visibility |
🚨 TLS as an Attack Surface
- Downgrade attacks
- Weak cipher exploitation
- Expired or fake certificates
- Misconfigured trust chains
- Encrypted malware traffic
🔍 Forensic Evidence in TLS Traffic
- Server Name Indication (SNI)
- Certificate details
- JA3 / JA3S fingerprints
- TLS version usage
- Handshake timing patterns
🕒 TLS Metadata in Timeline Reconstruction
- Initial encrypted session start
- Session renegotiation events
- Certificate rotation
- Encrypted C2 communication windows
⚖️ Legal & Investigative Importance
- Supports encrypted traffic attribution
- Proves secure communication intent
- Identifies misconfiguration negligence
- Accepted as technical expert evidence
TLS hides content, not behavior. Understanding SSL/TLS allows forensic investigators to analyze encrypted threats without breaking encryption.
2.18 TLS Abuse, Certificate Analysis & Evidence
🔓 How TLS Is Abused by Attackers
While TLS is designed to secure communications, attackers increasingly abuse it to hide malicious activity from security controls. Encryption protects content — but it also shields attackers.
Modern malware, phishing platforms, and command-and-control (C2) almost always use TLS to blend into legitimate traffic.
📜 What Is a Digital Certificate?
A digital certificate is a cryptographic document that binds a public key to an identity (domain, organization, or service). Certificates are issued by Certificate Authorities (CAs) and form the trust foundation of HTTPS.
🧩 Key Components of a TLS Certificate
| Component | Description | Forensic Relevance |
|---|---|---|
| Common Name (CN) | Primary domain name | Domain attribution |
| SAN (Subject Alt Name) | Additional domains | Hidden infrastructure discovery |
| Issuer | Certificate Authority | Trust chain analysis |
| Validity Period | Start & expiry dates | Attack timeline correlation |
| Public Key | Encryption key | Key reuse detection |
| Serial Number | Unique identifier | Cross-incident linking |
🚨 Common TLS & Certificate Abuse Techniques
- Using free certificates for malicious domains
- Short-lived certificates to evade detection
- Wildcard certificates covering many subdomains
- Self-signed certificates in malware
- Certificate reuse across attack campaigns
- Domain fronting with valid certificates
🔎 Certificate Analysis in Forensic Investigations
Certificate analysis allows investigators to extract intelligence from encrypted traffic without decryption.
- Identify malicious domains from certificates
- Correlate infrastructure via SAN entries
- Detect reused public keys
- Link phishing sites to known campaigns
- Detect suspicious certificate lifespans
🕵️ Certificate Transparency (CT) Logs
Certificate Transparency logs are public ledgers that record all issued TLS certificates. They provide historical visibility into certificate issuance.
- Discover hidden subdomains
- Track attacker domain creation
- Identify phishing infrastructure early
- Correlate multiple attacks
🧠 TLS Metadata as Evidence
| Metadata | What It Reveals |
|---|---|
| SNI | Target domain name |
| JA3 / JA3S | Client/server fingerprint |
| Certificate hash | Infrastructure reuse |
| Handshake timing | Automated vs human behavior |
🕒 TLS Evidence in Timeline Reconstruction
- First encrypted contact
- Certificate issuance timing
- Session duration patterns
- Rotation of certificates
- Infrastructure teardown
⚖️ Legal & Courtroom Relevance
- Certificates provide verifiable third-party evidence
- Link domains to attackers
- Support attribution without payload access
- Widely accepted in expert testimony
- Demonstrate intent and preparation
TLS does not eliminate evidence — it reshapes it. Certificate analysis allows forensic investigators to expose malicious infrastructure without breaking encryption.
🎓 Module 13 : Deleted Partition Recovery Techniques Successfully Completed
You have successfully completed this module of Cyber Forensics Investigation.
Keep building your expertise step by step — Learn Next Module →
Computer Forensics Investigation Process
The computer forensics investigation process is a systematic, repeatable methodology that ensures digital evidence is collected, preserved, analyzed, and presented in a legally acceptable manner. This module provides a comprehensive deep dive into the entire investigation lifecycle, from preparation to courtroom testimony.
A structured investigation process ensures evidence integrity, legal admissibility, and successful prosecution of cyber criminals.
3.1 Three Phases of Computer Forensics Investigation
The computer forensics investigation process is divided into three main phases that provide a structured framework for conducting thorough and legally defensible investigations.
Definition: Deals with tasks to be performed prior to the commencement of actual investigation.
📋 Key Activities:
- Setting up a computer forensics lab
- Building a forensics workstation
- Developing an investigation toolkit
- Setting up an investigation team
- Getting approval from relevant authority
- Establishing chain of custody procedures
- Creating incident response playbooks
- Training staff on evidence handling
- Obtaining necessary legal warrants
- Defining investigation scope and objectives
Definition: Considered as the main phase of the computer forensics investigation process.
📋 Key Activities:
- Acquisition: Collecting digital evidence from various sources
- Preservation: Maintaining evidence integrity using write blockers
- Analysis: Examining data to identify evidence
- Identification: Finding source of crime
- Attribution: Identifying the culprit behind the incident
- Timeline Reconstruction: Building chronological sequence
- Evidence Correlation: Linking evidence across sources
- Documentation: Recording all findings and actions
Definition: Deals with the documentation of all actions undertaken and findings during the course of an investigation.
📋 Key Activities:
- Documentation of investigation actions
- Documentation of findings and evidence
- Creating well-explained reports for target audience
- Providing adequate and acceptable evidence
- Preparing expert testimony materials
- Peer review of findings
- Legal review of reports
- Recommendations for prevention
🔄 Investigation Process Flow
Standardized 3-phase forensic investigation lifecycle
Pre-Investigation
Preparation & PlanningLegal authorization
Scope definition
Investigation
Acquisition & AnalysisTimeline reconstruction
Artifact correlation
Post-Investigation
Reporting & TestimonyExpert testimony
Chain of custody
3.2 Identification of Incident
🚨 What is Incident Identification?
Incident identification is the first step in a forensic investigation, where an abnormal or suspicious activity is detected and confirmed as a potential security incident requiring investigation.
📌 Common Indicators of an Incident
System Anomalies
- Unexpected system crashes
- Slow performance
- Unusual disk activity
- Unexpected pop-ups or messages
Authentication Issues
- Unauthorized login attempts
- Multiple failed logins
- Login from unusual locations
- Password change notifications
File Anomalies
- Missing or altered files
- New unknown files
- Changes in file permissions
- Unexpected file encryption
Security Alerts
- Antivirus or IDS alerts
- Firewall violation alerts
- SIEM notifications
- EDR detections
User Reports
- User complaints
- Suspicious behavior reports
- Phishing reports
- Unusual account activity
Network Indicators
- Unusual outbound connections
- Large data transfers
- Communication with known malicious IPs
- Unusual protocol usage
🔍 Incident Identification Process
Detection
Alert ReceivedTriage
Initial AssessmentConfirmation
Verify IncidentScope Definition
Identify Impacted SystemsEscalation
Activate IR Team🧠 Why Identification Matters
Defines Investigation Scope
Determines which systems and timeframes to examinePrevents Unnecessary Disruption
Avoids impacting unaffected systemsPrioritizes Response Actions
Focuses resources on critical systems3.3 Evidence Preservation
🧊 What is Evidence Preservation?
Evidence preservation ensures that digital evidence remains unchanged from the moment it is identified until it is presented in court. Any alteration can invalidate the entire investigation.
📦 Preservation Techniques
Isolation
Disconnect from network to prevent remote tamperingForensic Imaging
Create bit-for-bit copies of storage mediaWrite Blockers
Prevent accidental modifications during accessDocumentation
Record every action taken with evidence📜 Chain of Custody
The chain of custody records who handled the evidence, when it was handled, and why. It is a critical legal requirement for evidence admissibility.
| Field | Description | Example |
|---|---|---|
| Collected By | Name and signature of investigator | John Doe, CFCE |
| Date & Time | When evidence was acquired | 2024-01-15 14:30:00 EST |
| Location | Where evidence was collected | Server Room, Building A |
| Purpose | Reason for access or transfer | Forensic imaging for investigation |
| Signature | Authorization and receipt | Digital/Physical signature |
🛡️ Order of Volatility (RFC 3227)
CPU/Cache
Most VolatileRAM
MemoryNetwork
ConnectionsLogs
System LogsDisk
StorageBackups
Least Volatile3.4 Examination & Analysis
🔍 What is Examination?
Examination involves extracting relevant data from forensic images without modifying the original evidence. This is a technical, tool-driven process.
🧪 What is Analysis?
Analysis is the interpretation of examined data to determine what happened, how it happened, and who was involved. This is an investigative, human-driven process.
📂 Evidence Examined During Analysis
📁 File System Artifacts
- Allocated files and folders
- Deleted files and folders
- File metadata and timestamps
- Alternate Data Streams (ADS)
- Recycle Bin contents
📜 Log Files
- System logs (Windows Event Logs)
- Application logs
- Security and authentication logs
- Web server logs
- Firewall and IDS logs
🌐 User Activity Artifacts
- Browser history and cache
- Email and chat logs
- Downloaded files
- USB device history
- Recently accessed documents
🔑 Registry Artifacts
- User account information
- Installed programs
- Auto-start entries
- Network settings
- Recent activity
🧠 Memory Artifacts
- Running processes
- Network connections
- Loaded DLLs
- Decrypted passwords
- Malware in memory
🌐 Network Artifacts
- PCAP files
- DNS queries
- NetFlow data
- Proxy logs
- VPN connection logs
🧠 Timeline Reconstruction
Timeline analysis helps investigators reconstruct events by correlating timestamps from multiple sources.
File System
MACB TimesEvent Logs
Windows/SyslogNetwork
PCAP/FlowRegistry
USB/ExecComplete Timeline
Attack Reconstruction3.5 Documentation
📝 Why Documentation is Critical
Proper documentation ensures that the investigation process is transparent, repeatable, and legally defensible. Without documentation, even the strongest evidence can be challenged.
📘 What Should Be Documented?
Investigation Planning
- Investigation objectives and scope
- Legal authority and warrants
- Investigation team members
- Timeline and milestones
Evidence Handling
- Evidence collection procedures
- Chain of custody forms
- Hash values and verification
- Storage and access logs
Technical Process
- Tools used (name, version, settings)
- Analysis procedures followed
- Search terms and queries
- Timeline reconstruction method
Findings
- Evidence discovered
- Observations and conclusions
- Limitations encountered
- Peer review results
📊 Types of Reports
Technical Forensic Report
Detailed technical findings for IT staff and other forensic examiners. Includes methodology, tool outputs, and raw evidence references.
Executive Summary
High-level findings for management, legal teams, and non-technical stakeholders. Focuses on impact and recommendations.
Legal/Court Report
Formal evidentiary report for court proceedings. Includes chain of custody, methodology, and expert opinions.
📋 Sample Documentation Template
┌─────────────────────────────────────────────────────────────┐
│                 FORENSIC INVESTIGATION LOG                  │
├─────────────────────────────────────────────────────────────┤
│ Case Number: ______    Date: ______    Investigator: ______ │
├─────────────────────────────────────────────────────────────┤
│ Time       │ Action                    │ Tool     │ Hash     │
├────────────┼───────────────────────────┼──────────┼──────────┤
│ 09:00:00   │ Received evidence - Laptop│ N/A      │ -        │
│ 09:15:00   │ Photographed evidence     │ Camera   │ -        │
│ 09:30:00   │ Created forensic image    │ FTK Imager│ SHA256   │
│ 10:00:00   │ Verified hash             │ FTK Imager│ MATCHED  │
│ 10:30:00   │ Began file system analysis│ Autopsy  │ -        │
│ 14:00:00   │ Found deleted files       │ Autopsy  │ SHA256   │
│ 16:00:00   │ Exported evidence         │ Autopsy  │ SHA256   │
└────────────┴───────────────────────────┴──────────┴──────────┘
3.6 Court Presentation
⚖️ Presenting Evidence in Court
The final phase of a forensic investigation is presenting findings in a legal setting. Investigators may be required to explain technical details in a clear and understandable manner.
🎤 Role of a Forensic Expert Witness
Primary Responsibilities
- Explain digital evidence clearly to judges and juries
- Answer cross-examination questions from opposing counsel
- Defend investigation methodology and tool selection
- Maintain neutrality and professionalism at all times
- Present findings based on evidence, not speculation
Required Qualifications
- Relevant education and certifications (CHFI, GCFE, EnCE, etc.)
- Demonstrated experience in forensic investigations
- Knowledge of legal standards (Daubert, Frye)
- Understanding of chain of custody requirements
- Excellent communication and presentation skills
📋 Court Presentation Best Practices
Know Your Audience
Judges and juries may not have technical backgrounds. Avoid jargon and explain concepts simply.
Use Visual Aids
Timelines, diagrams, and charts help illustrate complex technical concepts.
Prepare Thoroughly
Review your report multiple times. Anticipate cross-examination questions.
⚠️ Common Courtroom Challenges
| Challenge | How to Address |
|---|---|
| "How do you know the evidence wasn't tampered with?" | Explain hash verification and chain of custody documentation |
| "Can you guarantee your tools are 100% accurate?" | Discuss tool validation, peer acceptance, and use of multiple tools |
| "Isn't it possible the data was planted?" | Explain forensic imaging, write blockers, and integrity verification |
| "Why didn't you examine X or Y?" | Refer to scope limitations and legal authorization boundaries |
🧠 Expert Witness Testimony Tips
- Answer only what you are asked
- Say "I don't know" when uncertain
- Stick to the evidence and facts
- Remain calm and professional
- Explain technical terms in plain language
- Don't guess or speculate
- Don't argue with opposing counsel
- Don't exceed your expertise
- Don't show bias or emotion
- Don't memorize testimony - know your material
Digital Evidence Gathering
This module focuses on the process of identifying, collecting, and securing digital evidence during a computer forensics investigation. Digital evidence is extremely fragile and can be easily altered or destroyed if not handled correctly. Understanding proper evidence gathering techniques is essential to ensure accuracy, integrity, and legal admissibility.
Improper evidence collection can invalidate even the strongest investigation.
4.1 Types of Digital Evidence
📂 What is Digital Evidence?
Digital evidence is any information of probative value stored or transmitted in digital form that can be used during an investigation.
🗂️ Common Types of Digital Evidence
- File-based evidence – documents, images, videos
- System artifacts – registry files, system logs
- Network evidence – traffic captures, firewall logs
- Email evidence – headers, attachments, content
- Application data – chat logs, browser history
- Cloud evidence – synced files, access logs
📌 Sources of Digital Evidence
- Hard disks and SSDs
- USB drives and memory cards
- Mobile devices
- Servers and cloud platforms
- Network devices (routers, firewalls)
4.2 Volatile vs Non-Volatile Data
⚡ What is Volatile Data?
Volatile data is data that is lost when a system is powered off. This type of evidence must be collected immediately.
🧠 Examples of Volatile Data
- RAM contents
- Running processes
- Active network connections
- Logged-in users
💾 What is Non-Volatile Data?
Non-volatile data persists even after power loss and can be collected later without immediate risk.
📂 Examples of Non-Volatile Data
- Hard disk files
- System logs
- Browser history
- Emails and documents
Always collect volatile data before powering off a system.
4.3 Evidence Seizure Procedures
📦 What is Evidence Seizure?
Evidence seizure refers to the legal and procedural act of taking control of digital devices or data for forensic examination.
📜 Standard Evidence Seizure Steps
- Identify devices and data sources
- Photograph and document the scene
- Label devices clearly
- Isolate devices from networks
- Transport securely to forensic lab
🧠 Live vs Dead Seizure
| Type | Description | Use Case |
|---|---|---|
| Live Seizure | System remains powered on | When volatile data is critical |
| Dead Seizure | System is powered off | Standard disk analysis |
4.4 Chain of Custody
🔗 What is Chain of Custody?
The chain of custody is a documented record that tracks every individual who handled the evidence from collection to court presentation.
📋 Chain of Custody Record Includes
- Evidence ID
- Description of evidence
- Date and time of collection
- Name and signature of handler
- Purpose of access
📂 Example Chain of Custody Table
| Date | Handled By | Action | Signature |
|---|---|---|---|
| 10-Jan-2026 | First Responder | Device seized | ✔ |
| 11-Jan-2026 | Forensic Analyst | Image created | ✔ |
| 15-Jan-2026 | Legal Team | Evidence review | ✔ |
Digital evidence is only valuable when its handling is fully documented and legally defensible.
Computer Forensics Lab
This module introduces the Computer Forensics Laboratory, a controlled and secure environment where digital evidence is examined and analyzed. A forensic lab is designed to ensure evidence integrity, repeatability, and legal compliance. Understanding lab components and setup is essential for conducting professional and court-admissible forensic investigations.
A forensic lab is not just a room with computers — it is a secure, legally controlled investigation environment.
5.1 Lab Components
🧪 What is a Computer Forensics Lab?
A Computer Forensics Lab is a dedicated facility equipped with specialized hardware, software, and procedures for handling digital evidence safely and securely.
🧱 Core Components of a Forensics Lab
- Secure physical space – restricted access
- Forensic workstations – high-performance systems
- Evidence storage – lockers, safes, sealed cabinets
- Write blockers – prevent data modification
- Forensic software – analysis and reporting tools
- Documentation systems – chain of custody records
📍 Types of Forensics Labs
- Law enforcement forensic labs
- Corporate internal investigation labs
- Academic / training labs
- Private forensic consulting labs
5.2 Forensic Workstations
🖥️ What is a Forensic Workstation?
A forensic workstation is a high-performance computer specifically configured for digital evidence acquisition and analysis. These systems are optimized for handling large data volumes without compromising evidence integrity.
⚙️ Recommended Workstation Specifications
| Component | Recommended Specification |
|---|---|
| Processor | Multi-core CPU (Intel i7 / Ryzen 7 or higher) |
| RAM | 16–64 GB |
| Storage | SSD for OS + large HDD/SSD for evidence |
| Operating System | Windows / Linux (forensic-ready) |
| Network | Isolated or controlled network access |
🔐 Security Measures
- User authentication and access control
- Disk encryption
- Audit logging
- Regular integrity checks
5.3 Write Blockers
🚫 What is a Write Blocker?
A write blocker is a hardware or software device that allows read-only access to a storage medium, preventing any modification of the original evidence.
🔧 Types of Write Blockers
- Hardware Write Blockers – physical devices (most reliable)
- Software Write Blockers – OS-based controls
📊 Hardware vs Software Write Blockers
| Type | Advantages | Limitations |
|---|---|---|
| Hardware | Highly reliable, court-accepted | Costly |
| Software | Flexible, low cost | Less trusted in court |
📌 When to Use Write Blockers
- During disk imaging
- While examining original media
- When accessing seized storage devices
Write blockers are a fundamental requirement for professional forensic investigations.
Setting up a Computer Forensics Lab
This module explains how to design, build, and manage a Computer Forensics Lab from scratch. A properly configured forensic lab ensures secure evidence handling, accurate analysis, and legal compliance. This knowledge is essential for professionals working in law enforcement, corporate investigations, incident response, and digital forensics consulting.
A forensic lab must prioritize security, integrity, and repeatability.
6.1 Lab Architecture Design
🏗️ What is Forensics Lab Architecture?
Lab architecture refers to the physical and logical layout of a forensic laboratory. It defines how evidence enters the lab, where it is stored, how analysis is performed, and how access is controlled.
🧱 Key Areas in a Forensics Lab
- Evidence intake area – initial receiving & logging
- Secure evidence storage – lockers, safes
- Forensic analysis zone – workstations
- Reporting & documentation area
- Access-controlled admin area
🔐 Access Control Design
- Biometric or keycard access
- CCTV monitoring
- Visitor logs
- Role-based access
6.2 Hardware & Software Setup
🖥️ Hardware Requirements
Forensic labs require specialized hardware to handle large volumes of data efficiently and securely.
🔧 Essential Hardware Components
- High-performance forensic workstations
- Write blockers (hardware preferred)
- Multiple storage adapters (SATA, NVMe, USB)
- External evidence storage drives
- UPS & power backup systems
💻 Software Requirements
Forensic software is used for acquisition, analysis, reporting, and evidence management.
📦 Categories of Forensic Software
- Disk imaging software
- File system analysis tools
- Memory forensics tools
- Log analysis utilities
- Reporting & documentation tools
6.3 Data Storage Planning
💾 Importance of Evidence Storage
Digital forensic investigations generate large volumes of data. Improper storage planning can lead to data loss, evidence corruption, or legal issues.
📊 Storage Planning Considerations
- Expected case volume
- Size of disk images
- Retention policies
- Backup requirements
- Encryption and access control
🔐 Secure Storage Practices
- Encrypted storage volumes
- Offline backups for critical evidence
- Redundant storage (RAID)
- Strict access logs
📜 Evidence Retention Policy
Evidence must be retained according to legal, organizational, and regulatory requirements.
A well-planned forensic lab ensures investigations remain accurate, secure, and legally defensible.
Understanding Hard Disk Drive (HDD)
This module provides a detailed understanding of hard disk structure, working principles, and data storage mechanisms, which is a critical foundation for computer forensics. Since most digital evidence is stored on storage media, forensic investigators must clearly understand how data is physically and logically stored, accessed, deleted, and recovered.
You cannot recover or analyze data correctly unless you understand how a hard disk stores it.
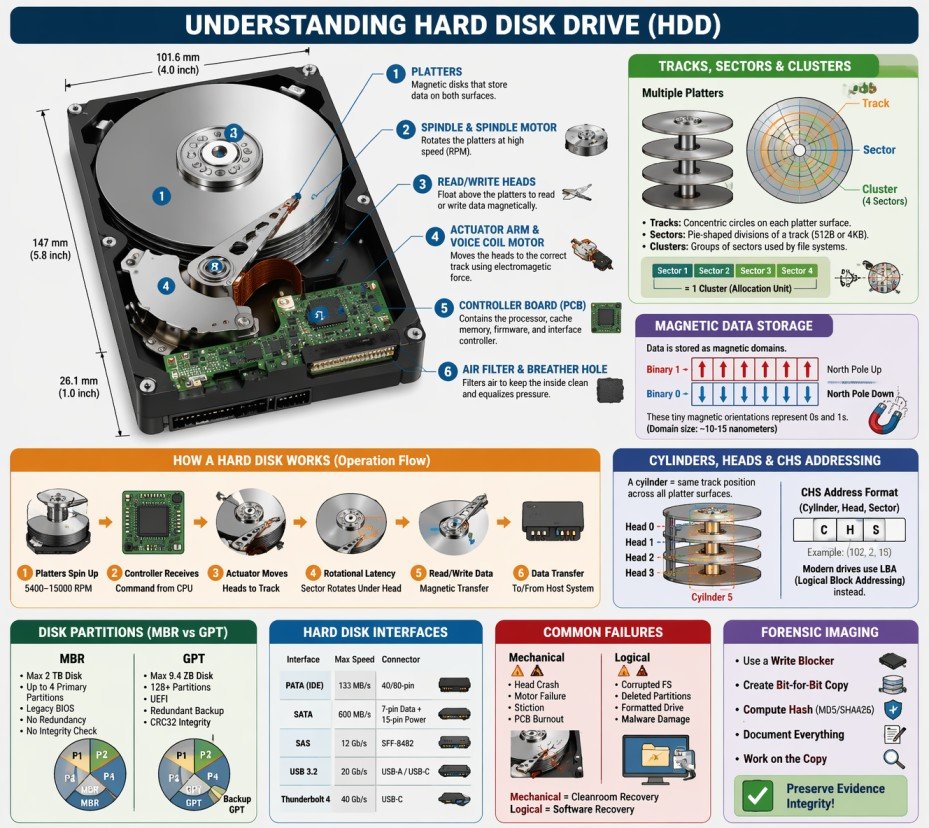
7.1 Hard Disk Architecture
💽 What is a Hard Disk Drive (HDD)?
A Hard Disk Drive (HDD) is a non-volatile storage device that uses magnetic storage to store and retrieve digital data. It consists of one or more rigid rotating platters coated with magnetic material, along with read/write heads that float above the platters to access data.
🔬 Physical Components of a Hard Disk
🔄 Platters
Platters are circular, rigid disks made of aluminum, glass, or ceramic substrate, coated with a thin magnetic layer. Data is stored magnetically on both surfaces of each platter.
- Typical materials: Aluminum alloy, glass, or ceramic
- Magnetic coating: Cobalt-based alloy or iron-platinum
- Number of platters: 1 to 5 (consumer drives), up to 10 (enterprise)
- Diameter: 3.5" (desktop), 2.5" (laptop), 1.8" (small devices), 1" (microdrives)
- Rotation speed: 5400 RPM, 7200 RPM, 10000 RPM, 15000 RPM (enterprise)
🌀 Spindle & Spindle Motor
The spindle is the central axle that holds the platters in place. The spindle motor rotates the platters at high, constant speeds.
- Spindle holds platters with precise spacing
- Motor types: Ball bearing, fluid dynamic bearing (FDB)
- Higher RPM = faster data access = more heat/noise
- FDB motors are quieter and more reliable
🖊️ Read/Write Heads
Read/Write heads are electromagnetic transducers that read data from and write data to the magnetic platters. They float nanometers above the platter surface.
- One head per platter surface (top and bottom)
- Head types: Inductive (write), MR/GMR/TMR (read)
- Flying height: 2-5 nanometers (1/1000th of a human hair!)
- Technology evolution: Ferrite → Thin-film → MR → GMR → TMR
🦾 Actuator Arm & Voice Coil Motor
The actuator arm positions the read/write heads over the correct track. The voice coil motor (VCM) moves the arm using electromagnetic force.
- Actuator arm moves heads radially across platters
- VCM: Similar to speaker coil operation
- Seek time: Average 8-12 ms for consumer drives
- Track-to-track seek: 0.2-0.5 ms
🔌 Controller Board (PCB)
The Printed Circuit Board (PCB) contains the drive's electronics, including the processor, cache memory, and interface controller.
- Processor: Manages drive operations and error correction
- Cache memory: 64MB to 512MB for buffering data
- ROM/Firmware: Stores drive operating code
- Interface controller: SATA, SAS, USB, etc.
🛡️ Air Filter & Breather Hole
The drive enclosure includes an air filter to maintain clean internal atmosphere and a breather hole to equalize pressure.
- Recirculation filter: Captures particles from internal air
- Breather filter: Prevents external contaminants from entering
- Helium-filled drives: Sealed completely (no breather hole)
📊 Hard Disk vs SSD Comparison
| Feature | Hard Disk Drive (HDD) | Solid State Drive (SSD) |
|---|---|---|
| Storage Technology | Magnetic platters | NAND flash memory |
| Moving Parts | Yes (platters, heads, motor) | No (fully electronic) |
| Read Speed | 80-160 MB/s | 500-7000 MB/s |
| Write Speed | 80-160 MB/s | 300-5000 MB/s |
| Access Time | 8-15 milliseconds | 0.02-0.1 milliseconds |
| Power Consumption | 6-9 Watts | 2-4 Watts |
| Noise Level | Audible (spinning, clicking) | Silent |
| Vibration Resistance | Low (sensitive to movement) | High (no moving parts) |
| Forensic Recovery | Easier (data remains after deletion) | Harder (TRIM, wear leveling) |
7.2 How Hard Disk Works
⚙️ The Complete Hard Disk Operation Process
A hard disk drive operates through a precise sequence of mechanical and electronic processes to read and write data with nanometer precision.
🔄 Step-by-Step Operation Flow
Platters Spin Up
5400-15000 RPMController Receives
Command from CPUActuator Moves
Positions headsRotational Latency
Sector rotates under headRead/Write Data
Magnetic transferData Transfer
To/from host system📝 Writing Data (Recording Process)
🔬 Magnetic Recording Steps
- The write head generates a magnetic field using an electromagnetic coil
- The magnetic field changes polarity based on the data bit (0 or 1)
- As the platter rotates under the head, the magnetic field magnetizes tiny regions called magnetic domains
- One magnetic orientation represents binary 1, the opposite represents binary 0
- Data is written in tracks and sectors sequentially
- The controller verifies the write operation by reading back the data
💡 Recording Technologies
- LMR (Longitudinal Magnetic Recording): Older technology, bits stored horizontally (limited density)
- PMR (Perpendicular Magnetic Recording): Bits stored vertically, higher density, used in modern drives
- SMR (Shingled Magnetic Recording): Overlapping tracks like roof shingles, maximum density
- HAMR (Heat-Assisted Magnetic Recording): Uses laser to heat tiny spots for writing
- MAMR (Microwave-Assisted Magnetic Recording): Uses microwave energy for writing
📖 Reading Data
- The read head (separate from write head) passes over the magnetized regions
- Magnetic fields induce a small electrical current in the read head (MR/GMR/TMR effect)
- The current strength varies based on the magnetic orientation
- Electronics interpret the current as binary 0 or 1
- Data is assembled into sectors and sent to the controller
- Error correction codes (ECC) verify data integrity
MR (1990s) → GMR (2000s) → TMR (2010s+)
Each generation provides
5-10x sensitivity increase
⏱️ Access Time Components
| Component | Description | Typical Time |
|---|---|---|
| Seek Time | Time to move heads to correct track | 8-12 ms (average) |
| Rotational Latency | Time for platter to rotate sector under head | 4-6 ms (7200 RPM average) |
| Controller Overhead | Processing time for commands | 0.5-1 ms |
| Data Transfer Time | Time to actually read/write data | 0.1-0.5 ms per sector |
| Total Access Time | Sum of all components | 12-20 ms average |
7.3 Tracks, Sectors & Clusters
📊 Understanding Disk Geometry
Hard disks organize data using a hierarchical structure: Tracks → Sectors → Clusters. Understanding this hierarchy is essential for data recovery and forensic analysis.
🌀 Tracks
A track is a concentric circular path on a platter where data is recorded magnetically. Each platter surface contains thousands of tracks, numbered from the outer edge (track 0) inward.
- Track density: 200,000 to 500,000 tracks per inch (TPI)
- Total tracks: 100,000 to 500,000 per platter surface
- Track 0: Located at the outermost edge, contains partition table and boot sector
- Zone Bit Recording (ZBR): Outer tracks have more sectors than inner tracks
A 1TB HDD has approximately
2,000,000+ tracks
across all platter surfaces
📦 Sectors
A sector is the smallest physical storage unit on a disk. Each sector has a unique address and stores a fixed amount of data.
| Sector Type | Size | Usage | Forensic Impact |
|---|---|---|---|
| Traditional (512e) | 512 bytes | Older drives, legacy compatibility | More overhead, slower access |
| Advanced Format (4Kn) | 4096 bytes (4KB) | Modern drives (2011+) | Efficient, better error correction | Mixed (512e emulation) | Physical 4KB, Logical 512B | Transitional drives | May cause alignment issues |
🧩 Clusters (Allocation Units)
A cluster (also called allocation unit) is a group of consecutive sectors and represents the smallest logical storage unit used by file systems.
📌 Cluster Sizes by File System
| Volume Size | NTFS Cluster | FAT32 Cluster |
|---|---|---|
| 1 GB | 4 KB | 4 KB |
| 8 GB | 4 KB | 8 KB |
| 32 GB | 4 KB | 16 KB |
| 64 GB | 8 KB | 32 KB |
| 256 GB | 8 KB | N/A |
| 1 TB | 8 KB | N/A |
⚠️ Forensic Importance of Clusters
- Slack Space: Unused space between file end and cluster end
- Even a 1-byte file occupies at least one full cluster (typically 4KB)
- Cluster size affects: Storage efficiency, performance, recovery
- Smaller clusters: Less slack space, more metadata overhead
- Larger clusters: More slack space, less metadata overhead
🔬 Slack Space Analysis
📊 Types of Slack Space
- RAM Slack: Space between logical file end and sector end. May contain RAM data.
- File Slack: Space between sector end and cluster end.
- Disk Slack: Unused space at the end of the last sector.
🔍 Forensic Value of Slack Space
- Contains fragments of previously stored files
- May contain passwords, documents, or images
- Can reveal data from deleted files
- Often overlooked by casual users
- Requires specialized forensic tools to access
7.4 Cylinders, Heads & CHS Addressing
🔄 What is a Cylinder?
A cylinder is the set of all tracks at the same radial position across all platter surfaces. For example, Track 5 on all platters forms Cylinder 5.
┌─────────────────────────────────────────────────────────────────┐
│                    CYLINDER CONCEPT                             │
├─────────────────────────────────────────────────────────────────┤
│                                                                 │
│    Platter 1 (Top)          Platter 1 (Bottom)                 │
│    ┌─────────────┐          ┌─────────────┐                    │
│    │   Track 5   │ ←─────── │   Track 5   │                    │
│    │   Track 4   │          │   Track 4   │                    │
│    │   Track 3   │          │   Track 3   │                    │
│    │   Track 2   │          │   Track 2   │                    │
│    │   Track 1   │          │   Track 1   │                    │
│    │   Track 0   │          │   Track 0   │                    │
│    └─────────────┘          └─────────────┘                    │
│                                                                 │
│    Platter 2 (Top)          Platter 2 (Bottom)                 │
│    ┌─────────────┐          ┌─────────────┐                    │
│    │   Track 5   │ ←─────── │   Track 5   │  ← Same track      │
│    │   Track 4   │          │   Track 4   │     position =     │
│    │   Track 3   │          │   Track 3   │     CYLINDER 5     │
│    │   Track 2   │          │   Track 2   │                    │
│    │   Track 1   │          │   Track 1   │                    │
│    │   Track 0   │          │   Track 0   │                    │
│    └─────────────┘          └─────────────┘                    │
│                                                                 │
│    CYLINDER = All tracks at the same position across ALL heads │
└─────────────────────────────────────────────────────────────────┘
📊 CHS (Cylinder-Head-Sector) Addressing
CHS addressing was the original method for locating data on a hard disk using three coordinates:
- C (Cylinder): Which cylinder (track position)
- H (Head): Which head (platter surface)
- S (Sector): Which sector within the track
| Addressing Method | Description | Limitation |
|---|---|---|
| CHS (Original) | Cylinder, Head, Sector | Max 8.4 GB (504 MB for BIOS) |
| LBA (Logical Block Addressing) | Single linear address (0,1,2...) | Virtually unlimited |
| LBA-48 | 48-bit addressing | Max 144 petabytes |
7.5 Disk Partitions
📂 What is a Disk Partition?
A disk partition is a logical division of a hard disk that allows multiple file systems or operating systems to exist on the same physical drive.
🗂️ Types of Partitions
📌 Primary Partition
Can host an OS and is bootable. MBR supports up to 4 primary partitions.
📦 Extended Partition
Container that holds multiple logical partitions. Cannot store data directly.
🔹 Logical Partition
Subdivisions inside extended partition. Function like primary partitions for data.
📜 MBR vs GPT Comparison
| Feature | MBR | GPT |
|---|---|---|
| Maximum Disk Size | 2 TB | 9.4 ZB |
| Maximum Partitions | 4 primary | 128 (Windows) / Unlimited |
| Boot Mode | Legacy BIOS | UEFI |
| Redundancy | No backup | Backup GPT at end of disk |
| Integrity Check | None | CRC32 checksum |
🔍 Forensic Importance of Partitions
- Deleted Partitions: Partition table entries may be recoverable
- Hidden Partitions: May contain evidence not visible to OS
- Partition Metadata: Reveals disk history and previous configurations
- Resized Partitions: Indicates data was moved or copied
- Encrypted Partitions: BitLocker, FileVault, LUKS - require keys
7.6 Data Storage & Magnetic Domains
🧲 How Data is Magnetically Stored
Data on a hard disk is stored as microscopic magnetized regions called magnetic domains.
┌─────────────────────────────────────────────────────────────────┐
│              MAGNETIC DOMAIN REPRESENTATION                     │
├─────────────────────────────────────────────────────────────────┤
│                                                                 │
│    Binary 1:  ████████████████████████████████████████████████ │
│               ↑                                                │
│               North Pole facing up (magnetized one direction)  │
│                                                                 │
│    Binary 0:  ░░░░░░░░░░░░░░░░░░░░░░░░░░░░░░░░░░░░░░░░░░░░░░░ │
│               ↑                                                │
│               North Pole facing down (opposite direction)      │
│                                                                 │
│    Data Example: "Hello" in binary:                            │
│                                                                 │
│    01001000 01100101 01101100 01101100 01101111                │
│    ░█░░█░░░ ░██░░█░█ ░███░░██ ░███░░██ ░███░░███              │
│    █ = Magnetized (1)  ░ = Not magnetized (0)                  │
│                                                                 │
│    Each magnetic domain is approximately 10-15 nanometers!     │
└─────────────────────────────────────────────────────────────────┘
📊 Recording Density Evolution
| Year | Technology | Density (bits/inch²) | Drive Capacity |
|---|---|---|---|
| 1956 | IBM 350 RAMAC | 2,000 | 5 MB |
| 1990s | MR (Magnetoresistive) | 1 billion | 1-10 GB |
| 2000s | GMR (Giant MR) | 100 billion | 40-500 GB |
| 2010s | PMR (Perpendicular) | 500 billion | 1-10 TB |
| 2020s | HAMR / MAMR | 2 trillion+ | 20-40 TB |
7.7 Hard Disk Interfaces
| Interface | Max Speed | Cable Length | Connector | Forensic Consideration |
|---|---|---|---|---|
| PATA (IDE) | 133 MB/s | 18 inches | 40/80-pin ribbon | Obsolete, found in older systems |
| SATA | 600 MB/s (SATA III) | 1 meter | 7-pin data, 15-pin power | Most common, easy to image |
| SAS | 12 Gb/s (SAS-3) | 10 meters | SFF-8482 | Enterprise drives, require SAS controller |
| USB | 20 Gb/s (USB 3.2) | 3 meters | USB-A, USB-C, Micro-USB | External drives, hot-swappable |
| Thunderbolt | 40 Gb/s (Thunderbolt 3/4) | 2 meters (copper) | USB-C | High-speed external, Mac compatibility |
7.8 Common Hard Disk Failures & Recovery
- Head Crash: Head touches platter surface
- Spindle Motor Failure: Platters won't spin
- Stiction: Heads stuck to platters
- Burned PCB: Electronics damaged
- Corrupted File System: Damaged MFT/FAT
- Deleted Partitions: Partition table erased
- Formatted Drive: File system overwritten
- Virus/Malware Damage: Data encrypted/deleted
- Always image the drive first (dd, FTK Imager)
- Work on forensic copies, never original
- Document hash values before and after
- Use write blockers to prevent modification
- Chain of custody must be maintained
7.9 Forensic Imaging of Hard Disks
📸 What is Forensic Imaging?
Forensic imaging creates a bit-for-bit exact copy of a hard disk, including allocated data, deleted files, slack space, and unallocated space.
🛠️ Common Forensic Imaging Tools
| Tool | Platform | Output Formats | Features |
|---|---|---|---|
| FTK Imager | Windows | E01, RAW, AFF | Free, GUI, memory capture |
| dd / dc3dd | Linux | RAW | CLI, built-in hashing |
| Guymager | Linux | E01, RAW, AFF | GUI, multi-threaded |
| EnCase Imager | Windows | E01 | Commercial, court-accepted |
📋 Forensic Imaging Best Practices
- Always use a hardware write blocker when connecting suspect drives
- Calculate and record hash values (MD5/SHA256) before and after imaging
- Create two forensic images (one for analysis, one for backup)
- Document every action in chain of custody logs
- Store original evidence in secure, controlled environment
- Never work on the original evidence - always use the forensic copy
# Create forensic image with hash verification
dc3dd if=/dev/sda of=evidence.dd hash=sha256 log=acquisition.log

# Verify image integrity
sha256sum evidence.dd
7.10 Hard Disk Terminology & Glossary
- Actuator: Mechanism that moves the read/write heads
- Bad Sector: Sector that cannot reliably store data
- Cache (Buffer): Fast memory for temporary data storage
- CHS: Cylinder-Head-Sector addressing method
- Cluster: Group of sectors (allocation unit)
- Cylinder: Same track position across all platters
- Firmware: Software stored on drive's PCB
- Flying Height: Distance between head and platter
- GMR: Giant Magnetoresistive (read head technology)
- Head: Reads/writes data to platters
- LBA: Logical Block Addressing (modern addressing)
- Platter: Magnetic disk that stores data
- RPM: Revolutions Per Minute (spindle speed)
- Sector: Smallest physical storage unit (512B/4KB)
- Seek Time: Time to move heads to correct track
- Slack Space: Unused space in allocated clusters
- Spindle: Axle that holds platters
- Track: Circular path on platter surface
- VCM: Voice Coil Motor (moves actuator)
- Write Blocker: Device preventing evidence modification
File Systems Analysis (Windows / Linux / macOS)
This module provides an in-depth understanding of file systems used by major operating systems — Windows, Linux, and macOS. File systems define how data is stored, indexed, accessed, modified, and deleted. For forensic investigators, file system analysis is critical for recovering deleted data, identifying hidden artifacts, reconstructing timelines, and detecting malicious activity.
Most digital evidence is found not in files themselves, but in file system metadata.
8.0 File System in Operating System
A file system is one of the most critical components of any operating system. It serves as the bridge between the physical storage hardware and the logical data structures that users and applications interact with daily.
📌 Historical Context
The concept of file systems dates back to the 1960s with early operating systems like Multics and UNIX. Before structured file systems, data storage was chaotic—programs had to know exact physical locations on disks. The invention of hierarchical file systems revolutionized data management, introducing directories, subdirectories, and systematic file naming conventions that we still use today.
🎯 Modern Relevance
Today, file systems handle petabytes of data across millions of files. They must balance speed, reliability, security, and efficiency. Modern challenges include SSD optimization, cloud storage integration, encryption requirements, and forensic readiness—making file system knowledge more critical than ever for IT professionals and forensic investigators.
8.0.1 What is a File System?
📁 Definition of File System
A File System is a method and data structure that an operating system uses to control how data is stored, organized, retrieved, and managed on a storage device (hard drive, SSD, USB drive, etc.).
🔬 Deep Dive: File System Components
A file system is not a single entity but a collection of interconnected components working together:
1. Naming and Directory Structure
The file system provides rules for naming files (length, allowed characters, case sensitivity) and organizes them into hierarchical directories. This creates a logical structure that users understand and can navigate. Different operating systems have different conventions—Windows uses backslashes (\) and drive letters (C:\), while Unix-like systems use forward slashes (/) and a unified root directory.
2. Metadata Management
Every file has associated metadata—information about the file, not the file content itself. This includes timestamps (creation, modification, access), ownership, permissions, size, and physical location on disk. Metadata is often more valuable forensically than the actual file content.
3. Space Allocation
The file system tracks which blocks of the storage device are in use, which are free, and where each file's data resides. Allocation methods include contiguous, linked, and indexed allocation, each with different performance and fragmentation characteristics.
4. Access Control
File systems implement security through permissions and access control lists (ACLs). This determines who can read, write, execute, or delete files. Understanding access control is crucial for forensic investigations involving unauthorized access.
📊 The Digital Filing Cabinet Analogy
| Physical Office | Digital File System | Forensic Equivalent |
|---|---|---|
| Filing Cabinet | Storage Device (HDD/SSD) | Physical evidence container |
| Drawer | Directory/Folder | Logical organization unit |
| Folder/Label | File Name | User-visible identifier |
| Index Card | Metadata/Inode | Critical forensic evidence |
| Document | File Content | Primary data of interest |
| Master Index | File Allocation Table | Location tracking system |
| Shredded Document | Deleted File | Recoverable evidence |
8.0.2 Why File Systems are Important?
File systems are fundamental to modern computing, and their importance extends far beyond simple file storage.
Data Organization
Structures data in a hierarchical manner for easy access
Without organization, finding specific data among billions of bytes would be impossible. File systems create logical structures that mirror human understanding of categorization and hierarchy.
Data Protection
Implements permissions, encryption, and access controls
Modern file systems provide granular security controls, preventing unauthorized access. NTFS supports encryption (EFS), while APFS offers native full-disk encryption, protecting data even if the device is stolen.
Data Integrity
Prevents data corruption through journaling and error checking
Journaling file systems (NTFS, EXT3/4, APFS) log changes before committing them, allowing recovery after crashes. This prevents data loss and corruption, which is critical for forensic integrity.
Performance
Optimizes read/write operations for speed
File systems implement caching, prefetching, and optimized allocation algorithms. EXT4 uses delayed allocation to improve performance, while NTFS uses master file table (MFT) for rapid file lookups.
Space Management
Efficiently allocates and tracks storage space
File systems prevent fragmentation, manage free space efficiently, and support features like compression and deduplication to maximize storage utilization. This is crucial for large-scale enterprise storage.
Forensic Value
Stores metadata critical for investigations
For forensic investigators, file systems are gold mines. Every file operation leaves traces—timestamps, logs, and metadata that reconstruct user activity. Deleted files, hidden data, and system artifacts are all preserved in the file system structure.
🏢 Business and Legal Importance
Regulatory Compliance
Organizations must comply with regulations like GDPR, HIPAA, and SOX that mandate proper data handling, retention, and audit trails. File systems provide the foundation for compliance through access logs, audit features, and secure deletion capabilities.
Legal Discovery (eDiscovery)
In litigation, parties must produce relevant digital evidence. File system metadata helps establish timelines, prove file authenticity, and identify document custodians. Understanding file systems is essential for legal professionals and forensic experts.
✅ Key Takeaway
File systems are not just technical components—they are the foundation of data management, security, and forensic investigation. Every file operation, every access attempt, and every deletion leaves evidence within the file system structure. Understanding file systems is essential for anyone working with digital data.
8.0.3 Types of File Systems
Different operating systems and use cases require different file system types. Each has unique characteristics, advantages, and forensic implications.
🪟 Windows File Systems
| File System | Introduced | Max Volume Size | Max File Size | Key Features |
|---|---|---|---|---|
| FAT32 | Windows 95 OSR2 | 2 TB | 4 GB | Compatible, simple, no journaling |
| exFAT | Windows Embedded CE 6.0 | 128 PB | 16 EB | Large files, cross-platform, USB drives |
| NTFS | Windows NT 3.1 | 256 TB | 16 EB | Journaling, permissions, encryption, compression |
| ReFS | Windows Server 2012 | 35 PB | 16 EB | Resilience, integrity streams, large volumes |
🐧 Linux File Systems
| File System | Introduced | Max Volume Size | Max File Size | Key Features |
|---|---|---|---|---|
| EXT2 | 1993 | 32 TB | 2 TB | No journaling, simple, legacy systems |
| EXT3 | 2001 | 32 TB | 2 TB | Journaling, backward compatible |
| EXT4 | 2008 | 1 EB | 16 TB | Extents, delayed allocation, faster |
| XFS | 1994 | 8 EB | 8 EB | Scalable, high performance, large files |
| Btrfs | 2009 | 16 EB | 16 EB | Copy-on-write, snapshots, checksums |
🍎 macOS File Systems
| File System | Introduced | Max Volume Size | Max File Size | Key Features |
|---|---|---|---|---|
| HFS+ | 1998 | 8 EB | 8 EB | Journaling, metadata, legacy macOS |
| APFS | 2017 | 16 EB | 16 EB | Snapshots, encryption, clones, space sharing |
🌍 Cross-Platform File Systems
FAT32
Most compatible file system, supported by Windows, macOS, Linux, game consoles, cameras, and more. The 4 GB file size limit is its biggest drawback for modern use.
exFAT
Microsoft's solution to FAT32's limitations. Supports large files and volumes while maintaining cross-platform compatibility. Ideal for USB drives and SD cards used across different devices.
🔬 Specialized File Systems
UDF
Optical discs (DVD, Blu-ray)ISO 9660
CD-ROMs, installation mediaZFS
Enterprise storage, Solaris, FreeBSDFUSE
Userspace file systems- NTFS: Highest forensic value - MFT, ADS, journaling, rich metadata
- EXT4: High forensic value - inodes, journal, extended attributes
- APFS: Very high forensic value - snapshots, clones, encryption
- FAT32/exFAT: Low forensic value - minimal metadata, no journaling
8.0.4 File System Architecture (Components)
Every file system consists of several logical components that work together to manage storage efficiently.
🔹 Boot Sector
Located at the very beginning of a storage device (Sector 0). Contains bootloader code and basic file system parameters. Crucial for system startup and forensic identification of file system type.
🔹 Superblock
Stores critical file system metadata: total size, block size, number of inodes, free space, file system state, and timestamps. Corrupted superblock can make the entire file system unmountable.
🔹 File Allocation Table
A map tracking which blocks belong to which files. Different implementations: FAT (simple table), MFT (NTFS - database), inodes (Unix-like - indexed structure).
🔹 Inodes / File Records
Data structures storing file metadata (timestamps, permissions, ownership, size, block pointers). Each file has a unique inode number. Deleted files may leave inode remnants.
🔹 Data Blocks
The actual storage units containing file content. Blocks are typically 4KB in size. Large files span multiple blocks, tracked by the file allocation structure.
🔹 Journal / Log
A transaction log recording pending file operations. Enables recovery after crashes. Critical forensic source for reconstructing deleted file activity.
🔹 MFT (NTFS)
Master File Table - a relational database containing a record for every file on an NTFS volume. Each record is typically 1KB and stores all metadata. Even deleted files leave MFT records until overwritten.
🔹 Inode Table (EXT)
A contiguous array storing all inodes on an EXT file system. The inode table size is fixed at creation time. Forensic tools can recover inodes even after file deletion.
🔹 Journal ($LogFile - NTFS)
NTFS journal records every metadata operation before execution. Can reveal file names and operations even when MFT records are overwritten.
🔹 Unallocated Space
Storage blocks marked as free but not yet overwritten. Contains deleted file data. Primary target for file carving and data recovery.
🔹 Slack Space
The unused space between the end of a file and the end of its last allocated cluster. May contain fragments of previously stored files, passwords, or sensitive data.
🔹 Alternate Data Streams (ADS - NTFS)
Hidden data attached to files without changing visible size. Commonly abused by malware for hiding payloads. Detected using forensic tools.
📊 Detailed File System Architecture Diagram
┌─────────────────────────────────────────────────────────────────────────────────────┐
│                              STORAGE DEVICE LAYOUT                                  │
├─────────────────────────────────────────────────────────────────────────────────────┤
│                                                                                     │
│  ┌─────────────────────────────────────────────────────────────────────────────┐    │
│  │                         PARTITION TABLE (MBR/GPT)                           │    │
│  │  ┌─────────┐ ┌─────────┐ ┌─────────┐ ┌─────────┐ ┌─────────────────────┐    │    │
│  │  │Partition│ │Partition│ │Partition│ │Partition│ │   Unpartitioned     │    │    │
│  │  │    1    │ │    2    │ │    3    │ │    4    │ │       Space         │    │    │
│  │  └─────────┘ └─────────┘ └─────────┘ └─────────┘ └─────────────────────┘    │    │
│  └─────────────────────────────────────────────────────────────────────────────┘    │
│                                                                                     │
│  ┌─────────────────────────────────────────────────────────────────────────────┐    │
│  │                         PARTITION 1 (Example: C:\)                          │    │
│  ├─────────────────────────────────────────────────────────────────────────────┤    │
│  │  ┌─────────────────────────────────────────────────────────────────────┐    │    │
│  │  │  Boot Sector  │  Superblock  │  File Allocation Table (FAT/MFT)     │    │    │
│  │  │   (Sector 0)  │  (Metadata)  │                                      │    │    │
│  │  └─────────────────────────────────────────────────────────────────────┘    │    │
│  │                                                                             │    │
│  │  ┌─────────────────────────────────────────────────────────────────────┐    │    │
│  │  │                    INODE / FILE TABLE (Metadata)                    │    │    │
│  │  │  ┌─────────┐ ┌─────────┐ ┌─────────┐ ┌─────────┐ ┌─────────┐        │    │    │
│  │  │  │ Inode 1 │ │ Inode 2 │ │ Inode 3 │ │ Inode 4 │ │ Inode 5 │  ...   │    │    │
│  │  │  │ File A  │ │ File B  │ │ File C  │ │ File D  │ │Deleted  │        │    │    │
│  │  │  │Metadata │ │Metadata │ │Metadata │ │Metadata │ │  File   │        │    │    │
│  │  │  └─────────┘ └─────────┘ └─────────┘ └─────────┘ └─────────┘        │    │    │
│  │  └─────────────────────────────────────────────────────────────────────┘    │    │
│  │                                                                             │    │
│  │  ┌─────────────────────────────────────────────────────────────────────┐    │    │
│  │  │                         DATA BLOCKS (4KB each)                      │    │    │
│  │  │  ┌───────┐ ┌───────┐ ┌───────┐ ┌───────┐ ┌───────┐ ┌───────┐        │    │    │
│  │  │  │Block 1│ │Block 2│ │Block 3│ │Block 4│ │Block 5│ │Block 6│  ...   │    │    │
│  │  │  │File A │ │File B │ │File A │ │File C │ │Free   │ │Free   │        │    │    │
│  │  │  │Part 1 │ │Part 1 │ │Part 2 │ │Part 1 │ │       │ │       │        │    │    │
│  │  │  └───────┘ └───────┘ └───────┘ └───────┘ └───────┘ └───────┘        │    │    │
│  │  └─────────────────────────────────────────────────────────────────────┘    │    │
│  │                                                                             │    │
│  │  ┌─────────────────────────────────────────────────────────────────────┐    │    │
│  │  │              UNALLOCATED SPACE + SLACK SPACE                        │    │    │
│  │  │  ┌─────────────────────────────────────────────────────────────┐    │    │    │
│  │  │  │  Remnants of deleted files | Temporary data | File fragments│    │    │    │
│  │  │  └─────────────────────────────────────────────────────────────┘    │    │    │
│  │  └─────────────────────────────────────────────────────────────────────┘    │    │
│  │                                                                             │    │
│  │  ┌─────────────────────────────────────────────────────────────────────┐    │    │
│  │  │                    JOURNAL / LOG FILE ($LogFile)                    │    │    │
│  │  │  ┌─────────────────────────────────────────────────────────────┐    │    │    │
│  │  │  │Transaction 1 │ Transaction 2 │ Transaction 3 │ Transaction N│    │    │    │
│  │  │  └─────────────────────────────────────────────────────────────┘    │    │    │
│  │  └─────────────────────────────────────────────────────────────────────┘    │    │
│  └─────────────────────────────────────────────────────────────────────────────┘    │
└─────────────────────────────────────────────────────────────────────────────────────┘
🔬 Block vs Extent-Based Allocation
Block-Based (FAT32, EXT2/3)
Files are allocated in fixed-size blocks (typically 4KB). Large files require many block pointers, causing overhead. The file allocation table must track each block individually, leading to fragmentation and performance issues with large files.
Extent-Based (NTFS, EXT4, APFS)
Files are allocated in contiguous ranges called extents. Each extent is described by (start_block, length). Large files need only a few extent entries, reducing metadata overhead and improving performance. Extents also reduce fragmentation.
8.0.5 File System Operations
Every interaction with a file triggers a series of file system operations, each leaving forensic traces.
- OS searches directory for existing file with same name (to avoid duplicates)
- Finds free inode/file record in the inode table
- Allocates initial data blocks from free space bitmap
- Updates file allocation table with block mapping
- Writes metadata (creation, modification timestamps, permissions, size=0)
- Updates directory entry with filename and inode reference
- Writes file content to allocated data blocks
- Updates file size and modification timestamp after content written
- If journaling, writes transaction record to journal
- OS parses path to find directory entry
- Retrieves inode/file record number from directory entry
- Checks read permissions against file's security descriptor
- Access denied if permissions insufficient
- If permitted, locates data blocks via allocation table
- Reads content from data blocks into memory buffer
- Updates access timestamp (atime) - if enabled
- May update read count in extended attributes
- Returns data to requesting application
- OS locates file (same as read operation)
- Checks write permissions
- If file content grows, may allocate additional blocks
- If file content shrinks, may free blocks
- Updates file allocation table with new block mappings
- Writes modified content to data blocks (may overwrite or write new blocks)
- Updates modification timestamp (mtime) and change timestamp (ctime)
- Updates file size in metadata
- Writes journal entry recording the transaction
- If copy-on-write (APFS), writes to new blocks, then updates pointers
- OS locates file in directory structure
- Checks delete permissions
- Marks inode/file record as "deleted" (not erased!)
- Marks all data blocks as "free" in allocation table
- Removes directory entry (filename removed from parent directory)
- If Recycle Bin/Trash enabled, file moved instead of deleted
- Writes deletion record to journal
- Actual data remains in unallocated space until overwritten
- Filename may be preserved in journal or deleted file records
- OS locates source file
- Checks permissions on source and target directories
- For rename: Updates directory entry with new name (inode unchanged)
- For move within same volume: Updates directory entry with new path (inode unchanged)
- For move across volumes: Copies file content to new location, then deletes original
- Updates change timestamp (ctime) - metadata changed
- Writes journal entry for directory changes
- Original data blocks remain unchanged (only pointers change)
- OS locates target file or directory
- Checks user has administrative or ownership rights
- Updates permission bits in inode/file record
- For NTFS: Updates Security Descriptor and ACL
- For EXT: Updates mode bits (read/write/execute for owner/group/other)
- For APFS: Updates permissions in inode
- Updates change timestamp (ctime) - metadata changed
- Writes journal entry recording permission change
- Logs security event in audit log (if auditing enabled)
📊 File System Operations Summary Table
| Operation | Metadata Changed | Forensic Artifacts | Recovery Potential |
|---|---|---|---|
| Create | Mtime, Ctime, Atime | Directory entry, inode, journal | Full recovery possible |
| Read | Atime (if enabled) | Access timestamp, audit logs | N/A (no data loss) |
| Modify | Mtime, Ctime, size | Journal, block changes, previous versions | Previous versions from snapshots |
| Delete | None (inode marked deleted) | Deleted inode, free blocks, journal | High - until overwritten |
| Rename/Move | Ctime | Directory changes, journal | αρίουFilename history in journal|
| Permission Change | Ctime | Security descriptor, journal, audit log | Full recovery |
🔍 Forensic Summary: Why File Systems Matter
- Deleted Files: File systems mark data as free but don't erase it → Recoverable until overwritten!
- Metadata: Timestamps (MACB - Modified, Accessed, Changed, Birth) reveal complete file activity history
- Slack Space: Unused space in clusters may contain fragments of previous files (passwords, documents, images)
- Journals/Logs: Record file operations even if files were deleted, providing operation history
- Hidden Data: Alternate Data Streams (NTFS) can hide malware or exfiltrated data
- Snapshots: APFS and some Linux file systems preserve previous file states, capturing deleted/modified content
- Unallocated Space: Primary source for file carving and recovering deleted content
- File System Journals: Can reveal file names and operations after metadata is gone
🧠 Key Takeaway
File systems are the foundation of digital forensics. Understanding how they work allows investigators to recover evidence that criminals thought was deleted forever. Every file operation leaves traces—timestamps change, journals record, and metadata persists. The key is knowing where to look and how to interpret what you find.
8.1 Windows File Systems (NTFS / FAT)
Microsoft Windows supports multiple file systems, with NTFS (New Technology File System) being the modern standard and FAT32/exFAT used for compatibility and removable media.
📂 NTFS (New Technology File System)
Introduced: Windows NT 3.1 (1993) | Current version: NTFS 3.1 (Windows XP onwards)
NTFS is a journaled, metadata-rich file system designed for reliability, security, and large volumes.
🔹 Key Features of NTFS
Journaling ($LogFile)
Records all metadata changes before execution. Enables recovery after crashes and provides forensic audit trail.
Master File Table (MFT)
Relational database with one record per file. Each record stores all metadata including timestamps, size, and data locations.
Security & Permissions
Supports file-level permissions, encryption (EFS), and auditing. Security descriptors stored in $Secure file.
Alternate Data Streams (ADS)
Multiple data streams per file. Primary stream visible; others hidden. Frequently abused by malware.
Compression & Encryption
Native file compression and Encrypting File System (EFS) for data protection.
Hard Links & Junctions
Multiple directory entries pointing to same file data. Used for system compatibility and backups.
🔹 NTFS Structure - Deep Dive
| System File | Purpose | Forensic Value |
|---|---|---|
| $MFT (Master File Table) | Central database of all files and folders | Extremely High - Contains metadata for every file, even deleted ones |
| $MFTMirr | Backup of first 4 MFT records | High - Recovery if primary MFT corrupted |
| $LogFile | Transaction journal | Very High - Records file operations, reveals deleted file names |
| $Bitmap | Tracks used/free clusters | Medium - Shows which clusters contain data |
| $Boot | Boot sector and bootstrap code | High - Identifies file system parameters |
| $Secure | Security descriptors and ACLs | High - Reveals file permissions and ownership |
| $Extend | Extended metadata (quotas, object IDs, reparse points) | Medium - Contains additional forensic artifacts |
🔹 MFT Record Structure
┌─────────────────────────────────────────────────────────────────┐
│                    MFT RECORD (1024 bytes)                      │
├─────────────────────────────────────────────────────────────────┤
│  Offset  │ Size │ Field              │ Description              │
├──────────┼──────┼────────────────────┼──────────────────────────┤
│  0x00    │ 4    │ Signature          │ "FILE" magic number      │
│  0x04    │ 2    │ Update Sequence    │ For consistency check    │
│  0x06    │ 2    │ Update Seq Size    │ Size of sequence array   │
│  0x08    │ 8    │ LSN                │ Log file sequence number │
│  0x10    │ 2    │ Sequence Number    │ Increments when reused   │
│  0x12    │ 2    │ Hard Links         │ Number of hard links     │
│  0x14    │ 2    │ Attribute Offset   │ Offset to first attribute│
│  0x16    │ 2    │ Flags              │ In use, directory, etc.  │
│  0x18    │ 4    │ Real Size          │ Actual record size       │
│  0x1C    │ 4    │ Allocated Size     │ Allocated record size    │
│  0x20    │ 8    │ Base Record Ref    │ For extended records     │
│  0x28    │ 2    │ Next Attribute ID  │ ID for next attribute    │
│  0x2A    │ 2    │ Reserved           │ Padding                  │
│  0x2C    │ 4    │ MFT Record Number  │ Record index in MFT      │
│  0x30    │      │ Attributes...      │ Variable length          │
└─────────────────────────────────────────────────────────────────┘

                    ATTRIBUTE TYPES:
┌─────────────────────────────────────────────────────────────────┐
│  Type │ Name                    │ Forensic Value               │
├──────┼─────────────────────────┼───────────────────────────────┤
│  0x10 │ $STANDARD_INFORMATION   │ MACB timestamps (critical!)   │
│  0x20 │ $ATTRIBUTE_LIST         │ For multi-record files        │
│  0x30 │ $FILE_NAME              │ Filename + parent directory   │
│  0x40 │ $OBJECT_ID              │ Unique object identifier      │
│  0x50 │ $SECURITY_DESCRIPTOR    │ Permissions and ownership     │
│  0x60 │ $VOLUME_NAME            │ Volume name                   │
│  0x70 │ $VOLUME_INFORMATION     │ Volume flags                  │
│  0x80 │ $DATA                   │ Actual file content           │
│  0x90 │ $INDEX_ROOT             │ Directory index root          │
│  0xA0 │ $INDEX_ALLOCATION       │ Directory index allocation    │
│  0xB0 │ $BITMAP                 │ Index bitmap                  │
│  0xC0 │ $REPARSE_POINT          │ Symbolic link / junction      │
│  0xD0 │ $EA_INFORMATION         │ Extended attribute info       │
│  0xE0 │ $EA                     │ Extended attributes           │
└─────────────────────────────────────────────────────────────────┘
🔹 NTFS Timestamps (MACB)
| Attribute | Timestamp Type | Forensic Significance |
|---|---|---|
| $STANDARD_INFORMATION | Modified (M), Accessed (A), Created (C), Changed (B) | Most reliable, but can be modified by attackers |
| $FILE_NAME | Modified, Created, Changed | Secondary timestamps - often reveal timestamp tampering |
| $OBJECT_ID | Created | Unique file identifier - tracks file across moves |
🔹 FAT32 & exFAT
FAT32
- Max Volume: 2 TB
- Max File: 4 GB
- Journaling: No
- Permissions: No
- Forensic Value: Low - limited metadata
- Common Use: USB drives, older systems, boot partitions
exFAT
- Max Volume: 128 PB
- Max File: 16 EB
- Journaling: No (limited)
- Permissions: Limited
- Forensic Value: Low to Medium
- Common Use: SDXC cards, large USB drives
8.2 Linux File Systems (EXT Family)
The EXT (Extended File System) family is the most common file system on Linux systems, evolving from EXT2 (no journaling) to EXT3 (journaling) to EXT4 (extents, delayed allocation).
🐧 EXT2, EXT3, EXT4 Comparison
| Feature | EXT2 | EXT3 | EXT4 |
|---|---|---|---|
| Journaling | No | Yes | Yes (with checksums) |
| Extents | No | No | Yes |
| Max Volume | 32 TB | 32 TB | 1 EB |
| Max File | 2 TB | 2 TB | 16 TB |
| Timestamps | Seconds | Seconds | Nanoseconds |
| Ext. Attributes | No | No | Yes |
🔹 EXT4 Inode Structure
┌─────────────────────────────────────────────────────────────────┐
│                    EXT4 INODE STRUCTURE (256 bytes)             │
├─────────────────────────────────────────────────────────────────┤
│  Offset  │ Size │ Field              │ Description              │
├──────────┼──────┼────────────────────┼──────────────────────────┤
│  0x00    │ 2    │ Mode               │ File type + permissions  │
│  0x02    │ 2    │ UID                │ Owner user ID            │
│  0x04    │ 4    │ Size               │ File size in bytes       │
│  0x08    │ 4    │ Atime              │ Access timestamp         │
│  0x0C    │ 4    │ Ctime              │ Change timestamp         │
│  0x10    │ 4    │ Mtime              │ Modify timestamp         │
│  0x14    │ 4    │ Dtime              │ Delete timestamp         │
│  0x18    │ 2    │ GID                │ Group ID                 │
│  0x1A    │ 2    │ Links Count        │ Hard link count          │
│  0x1C    │ 4    │ Blocks             │ Block count              │
│  0x20    │ 4    │ Flags              │ Inode flags              │
│  0x24    │ 4    │ OS Specific        │ OS-dependent value       │
│  0x28    │ 60   │ Block Pointers     │ Direct, indirect blocks  │
│  0x64    │ 4    │ Generation         │ Inode generation number  │
│  0x68    │ 4    │ EA Block           │ Extended attribute block │
│  0x6C    │ 4    │ i_size_high        │ Upper 32 bits of size    │
│  0x70    │ 4    │ i_frag             │ Fragment number          │
│  0x78    │ 12   │ i_osd2             │ OS-dependent data        │
│  0x84    │ 16   │ i_extra_isize      │ Extended inode space     │
│  0x94    │ 4    │ i_crtime           │ Creation timestamp       │
│  0x98    │ 4    │ i_crtime_extra     │ Creation timestamp nano  │
└─────────────────────────────────────────────────────────────────┘

                    BLOCK POINTERS (60 bytes):
┌─────────────────────────────────────────────────────────────────┐
│  12 Direct Block Pointers    (12 × 4 = 48 bytes)               │
│  1 Singly Indirect Pointer    (4 bytes)                        │
│  1 Doubly Indirect Pointer    (4 bytes)                        │
│  1 Triply Indirect Pointer    (4 bytes)                        │
└─────────────────────────────────────────────────────────────────┘
🔹 EXT4 Features - Forensic Importance
📋 Journaling (EXT3/4)
The journal records metadata changes before committing them to disk. Forensic value includes:
- Recovery of recently deleted file names
- Timeline of file system operations
- Evidence of anti-forensic activity (journal clearing)
- Reconstruction of attacker actions
📦 Extents
EXT4 uses extent-based allocation for large files. Forensic benefits:
- Reduced fragmentation - easier file carving
- Faster file location during analysis
- Efficient handling of large files
- Less metadata to parse
⏱️ Nanosecond Timestamps
EXT4 supports nanosecond precision timestamps. Forensic value:
- More accurate timeline reconstruction
- Detection of timestamp manipulation
- Fine-grained activity correlation
- Distinguishing between rapid operations
🗑️ Deletion Timestamp (Dtime)
EXT4 records when a file was deleted. Unique forensic artifact:
- Exact deletion time of files
- Correlates with user activity logs
- Establishes timeline of data destruction
- Not present in NTFS or FAT
8.3 macOS File Systems (APFS)
APFS (Apple File System) is the modern file system for macOS, iOS, watchOS, and tvOS, replacing HFS+. It features copy-on-write, snapshots, strong encryption, and space sharing.
Introduced: macOS High Sierra (2017) | Current version: APFS 2.0
APFS is optimized for SSDs and flash storage, with a focus on encryption, performance, and reliability.
🍎 Key Features of APFS
Snapshots
Point-in-time read-only instances of the file system. Forensic gold - captures deleted files!
Copy-on-Write (CoW)
Data not overwritten; writes go to new blocks. Preserves previous versions for forensic recovery.
Native Encryption
Full-disk encryption, per-file keys, hardware security integration.
Space Sharing
Multiple volumes share free space dynamically. No fixed partition sizes.
Clones
Instant file/directory copies without duplicating data. Space-efficient backups.
Fusion Support
Optimizes data placement between SSD and HDD for performance.
🔬 APFS Container Architecture
┌─────────────────────────────────────────────────────────────────┐
│                      APFS CONTAINER                             │
├─────────────────────────────────────────────────────────────────┤
│  ┌─────────────────────────────────────────────────────────┐   │
│  │                    Container Superblock                  │   │
│  │              (File system metadata, block maps)          │   │
│  └─────────────────────────────────────────────────────────┘   │
│                                                                 │
│  ┌──────────────┐  ┌──────────────┐  ┌──────────────┐         │
│  │   Volume 1   │  │   Volume 2   │  │   Volume 3   │         │
│  │   (macOS)    │  │   (Data)     │  │  (Backup)    │         │
│  │              │  │              │  │              │         │
│  │ ┌──────────┐ │  │ ┌──────────┐ │  │ ┌──────────┐ │         │
│  │ │Snapshots │ │  │ │Snapshots │ │  │ │Snapshots │ │         │
│  │ └──────────┘ │  │ └──────────┘ │  │ └──────────┘ │         │
│  └──────────────┘  └──────────────┘  └──────────────┘         │
│                                                                 │
│  ┌─────────────────────────────────────────────────────────┐   │
│  │                   Free Space (Shared)                    │   │
│  │         (Dynamically allocated to any volume)            │   │
│  └─────────────────────────────────────────────────────────┘   │
└─────────────────────────────────────────────────────────────────┘
🔹 APFS Snapshots - Forensic Gold
APFS snapshots are read-only point-in-time copies of the file system. They are created automatically by Time Machine and system updates, and can be created manually.
Forensic Value of Snapshots:
- Recover deleted files - Files deleted after snapshot are still accessible in snapshot
- Access previous versions - View file contents before modification
- Timeline reconstruction - Multiple snapshots provide granular timeline
- Evidence of tampering - Snapshots cannot be easily altered by attackers
- Malware detection - Compare current system with clean snapshot
- Ransomware recovery - Restore encrypted files from before attack
🔐 APFS Encryption
Encryption Models
- No Encryption: Standard APFS (rare)
- Single-key Encryption: One key for entire container
- Multi-key Encryption: Per-file keys + metadata key
- Hardware-based: Secure Enclave integration (T2/M1/M2/M3 chips)
Forensic Challenges
- Encrypted volumes require password or recovery key
- Hardware-based encryption may require logic board analysis
- FileVault2 full-disk encryption is standard on modern macOS
- Memory forensics may capture decryption keys
- Legal process required for password acquisition
📊 File System Comparison Summary
| Feature | NTFS | EXT4 | APFS |
|---|---|---|---|
| Journaling | ✅ Yes | ✅ Yes | ✅ Yes |
| Snapshots | ❌ No | ❌ No (limited Btrfs) | ✅ Yes (native) |
| Encryption | EFS (file-level) | dm-crypt (optional) | Native multi-key |
| Extents | ✅ Yes | ✅ Yes | ✅ Yes |
| Copy-on-Write | ❌ No | ❌ No | ✅ Yes |
| Forensic Value | Very High | High | Very High |
Windows File Systems Forensics (NTFS Deep Dive)
This module delivers a deep forensic-level understanding of NTFS (New Technology File System), the default file system used by modern Windows operating systems. NTFS is rich in metadata and logs, making it one of the most important sources of digital evidence in incident response, cybercrime investigations, insider threat cases, and malware analysis.
Even if a file is deleted, NTFS often retains its metadata long after removal.
9.1 NTFS Architecture & Internal Structure
🧱 What Makes NTFS Forensically Powerful?
NTFS is a metadata-driven file system. Every file, directory, and even system object is stored as a record inside a central database called the Master File Table (MFT).
📂 Core NTFS Components
- $MFT – Master File Table (heart of NTFS)
- $MFTMirr – Backup of critical MFT entries
- $LogFile – NTFS transaction journal
- $Bitmap – Tracks used/free clusters
- $Boot – Boot sector metadata
- $Volume – Volume information
🧠 MFT Record Structure
Each file or folder has at least one MFT record (usually 1024 bytes). The record contains multiple attributes describing the file.
📑 Common NTFS Attributes
- $STANDARD_INFORMATION – MACB timestamps
- $FILE_NAME – File name & parent directory
- $DATA – File content
- $SECURITY_DESCRIPTOR – Permissions
- $OBJECT_ID – Object tracking
9.2 NTFS Timestamps, MACB & Timeline Analysis
⏱️ Understanding MACB Timestamps
NTFS tracks file activity using four timestamps, commonly referred to as MACB. These timestamps are critical for timeline reconstruction.
| Timestamp | Description | Forensic Use |
|---|---|---|
| Modified (M) | File content changed | Detect data manipulation |
| Accessed (A) | File opened/read | User activity tracking |
| Created (C) | File creation time | Establish origin |
| Changed (B) | Metadata modified | Detect renames/moves |
🔍 Dual Timestamp Storage
- $STANDARD_INFORMATION timestamps
- $FILE_NAME timestamps
Attackers may alter one timestamp set while leaving the other intact.
📈 Timeline Reconstruction
By correlating NTFS timestamps with logs, registry entries, and application artifacts, investigators can build a minute-by-minute activity timeline.
9.3 Deleted Files, Slack Space & Unallocated Space
🗑️ What Happens When a File is Deleted?
Deleting a file in NTFS does NOT immediately remove its data. Instead, NTFS marks the file record as deleted and frees its clusters.
🔎 Recoverable Evidence Locations
- Deleted MFT Records
- Slack Space – unused space in allocated clusters
- Unallocated Space – freed clusters
- $Recycle.Bin
📂 File Slack vs Disk Slack
- File Slack – leftover data within last cluster
- Disk Slack – space between file end and sector end
9.4 Alternate Data Streams (ADS) & Hidden Data
🕵️ What are Alternate Data Streams?
NTFS allows files to contain multiple data streams. The primary stream is visible, while others may remain hidden.
📌 Forensic Importance of ADS
- Hidden malware payloads
- Covert data storage
- Insider data exfiltration
🔍 Detection Concepts
- File size mismatch
- Unusual MFT attributes
- Specialized forensic parsing
9.5 NTFS Journaling, Logs & Evidence Correlation
📘 NTFS Journaling ($LogFile)
NTFS uses transactional journaling to maintain file system consistency. The journal records metadata operations before they are committed.
🧠 Forensic Value of NTFS Logs
- Detect file creation/deletion attempts
- Identify failed operations
- Reconstruct partial activity
🧩 Correlation with Other Artifacts
| Artifact | Correlation Purpose |
|---|---|
| Windows Event Logs | User & system actions |
| Registry | Program execution & persistence |
| Prefetch | Executable execution evidence |
| Browser Artifacts | Download origins |
NTFS forensics is about metadata correlation, not just file recovery.
Data Acquisition Tools & Techniques (Live vs Dead Acquisition)
Data acquisition is the foundation of digital forensics. This module explains how investigators legally and technically collect digital evidence without altering or destroying it. You will learn the differences between Live Acquisition and Dead Acquisition, when to use each method, and how forensic tools preserve evidence integrity.
If evidence is collected incorrectly, the entire investigation may fail in court.
10.1 What is Data Acquisition in Digital Forensics?
📥 Definition
Data Acquisition is the process of creating a forensically sound copy of digital data from storage media, memory, or live systems for investigation and legal analysis.
Investigators must acquire data without modifying the original evidence.
🎯 Objectives of Data Acquisition
- Preserve original evidence
- Ensure data integrity
- Enable repeatable analysis
- Maintain legal admissibility
- Prevent contamination or loss
⚖️ Legal Importance
- Evidence must be collected under proper authorization
- Chain of custody must be documented
- Hash values must verify authenticity
10.2 Types of Data Acquisition
📊 Major Acquisition Categories
- Live Acquisition – System is powered ON
- Dead Acquisition – System is powered OFF
- Logical Acquisition – Files & folders
- Physical Acquisition – Entire disk or memory
| Type | System State | Evidence Scope |
|---|---|---|
| Live | Powered ON | RAM, processes, network |
| Dead | Powered OFF | Disk, partitions, deleted data |
| Logical | Any | Selected files |
| Physical | Any | Entire storage |
10.3 Live Data Acquisition (System Powered ON)
⚡ What is Live Acquisition?
Live Acquisition involves collecting data from a system while it is running. This method is essential for capturing volatile data.
🧠 Volatile Data Examples
- RAM contents
- Running processes
- Open network connections
- Logged-in users
- Encryption keys
📈 Advantages of Live Acquisition
- Captures encryption keys
- Detects malware in memory
- Reveals active attacker presence
⚠️ Risks & Limitations
- System state is altered during collection
- Higher chance of evidence contamination
- Defense may challenge integrity
10.4 Dead Data Acquisition (System Powered OFF)
🛑 What is Dead Acquisition?
Dead Acquisition is performed when the system is powered off and storage media is removed or accessed using forensic hardware.
📂 Data Collected
- Entire hard disk
- Deleted files
- Slack & unallocated space
- Hidden partitions
🛡️ Write Blockers
Write blockers prevent any modification to the original storage device during acquisition.
📉 Limitations
- No access to RAM data
- Encrypted disks may be unreadable
- Active malware may disappear
10.5 Hashing, Verification & Evidence Integrity
🔐 What is Hashing?
Hashing generates a unique digital fingerprint for evidence using cryptographic algorithms.
🔢 Common Hash Algorithms
- MD5 (legacy)
- SHA-1 (deprecated)
- SHA-256 / SHA-512 (recommended)
📊 Why Hashing Matters
- Proves evidence was not altered
- Supports courtroom admissibility
- Ensures repeatable analysis
📋 Chain of Custody
- Who collected the evidence
- When and where it was collected
- How it was stored
- Who accessed it
Acquisition is not just technical — it is legal proof.
Disk & Memory Imaging Techniques
Disk and memory imaging are the core pillars of digital forensic investigations. This module explains how forensic investigators create bit-by-bit exact replicas of storage devices and system memory to ensure evidence integrity, repeatability, and legal admissibility. You will learn disk imaging concepts, memory acquisition, image formats, validation, and common forensic challenges.
Never analyze original evidence — always work on verified forensic images.
11.1 What is Forensic Imaging?
📀 Definition
Forensic imaging is the process of creating an exact bit-for-bit copy of digital storage or memory. This copy includes visible data, deleted files, slack space, unallocated space, and hidden metadata.
🎯 Objectives of Forensic Imaging
- Preserve original evidence
- Ensure repeatable analysis
- Maintain legal admissibility
- Protect evidence from modification
- Enable multiple investigations
⚖️ Legal Importance
- Original device remains sealed
- Hash values prove authenticity
- Defense can verify image integrity
11.2 Disk Imaging Techniques
🧱 What is Disk Imaging?
Disk imaging involves capturing the entire storage device, including file systems, partitions, boot records, deleted data, and unused space.
📂 What Disk Imaging Captures
- Operating system files
- User documents
- Deleted files
- Slack & unallocated space
- Hidden partitions
- Boot records (MBR/GPT)
🛡️ Role of Write Blockers
Write blockers ensure the original disk cannot be altered during acquisition.
- Hardware write blockers (preferred)
- Software write blockers (secondary)
11.3 Memory Imaging (RAM Acquisition)
🧠 What is Memory Imaging?
Memory imaging is the process of capturing volatile data stored in system RAM while the system is powered on.
⚡ Why Memory Imaging is Critical
- RAM holds running malware
- Encryption keys exist only in memory
- Active network connections
- Logged-in user credentials
📊 Evidence Found in Memory
- Process lists
- Command history
- Injected code
- File-less malware
- Passwords & tokens
11.4 Forensic Image Formats
📦 Common Disk Image Formats
| Format | Description | Forensic Use |
|---|---|---|
| RAW (DD) | Exact bit-for-bit copy | Most widely accepted |
| E01 (EnCase) | Compressed + metadata | Court-preferred |
| AFF | Open forensic format | Academic & research |
🧠 Memory Image Formats
- RAW memory dumps
- Compressed memory images
- Tool-specific formats
11.5 Image Validation, Hashing & Documentation
🔐 Image Validation
Validation ensures that the forensic image is identical to the original source.
🔢 Hashing Process
- Hash original media before imaging
- Hash image after acquisition
- Compare hash values
📌 Common Hash Algorithms
- MD5 (legacy)
- SHA-1 (deprecated)
- SHA-256 / SHA-512 (recommended)
📋 Documentation Requirements
- Imaging date & time
- Investigator name
- Tool & version used
- Hash values
- Storage location
Imaging is a legal process as much as it is a technical one.
Recovery of Deleted Files & Folders
File deletion is one of the most misunderstood concepts in computing. This module explains how deleted data can still exist on storage media, how forensic investigators recover it, and how courts evaluate recovered evidence. You will learn the technical deletion process, recovery locations, limitations, and anti-forensic challenges.
Deleting a file does not immediately destroy the data.
12.1 What Happens When a File is Deleted?
🗑️ Logical vs Physical Deletion
When a file is deleted, the operating system does not erase the data immediately. Instead, it removes references to the file and marks the storage space as available.
| Deletion Type | Description |
|---|---|
| Logical Deletion | File system metadata is removed |
| Physical Deletion | Data blocks are overwritten |
📂 File System Behavior
- File entry marked as deleted
- Clusters marked as free
- Data remains until overwritten
⚖️ Forensic Importance
Investigators rely on this delay between deletion and overwrite to recover evidence in criminal and civil cases.
12.2 Locations Where Deleted Data Exists
🔍 Primary Evidence Locations
- Recycle Bin
- Deleted MFT Records
- Unallocated Space
- File Slack Space
- Volume Shadow Copies
📦 Slack Space
Slack space contains leftover data from previously stored files. This data can include fragments of documents, images, or emails.
🧠 Volume Shadow Copies
Windows creates shadow copies for backup and restore purposes. Deleted files may still exist inside older snapshots.
12.3 File Recovery Techniques
🛠️ Metadata-Based Recovery
This method uses file system metadata (such as MFT entries) to reconstruct deleted files.
🔬 Signature-Based (Carving) Recovery
File carving recovers files based on known file headers and footers, even if metadata is missing.
| Technique | Strength | Limitation |
|---|---|---|
| Metadata Recovery | Preserves filename & timestamps | Fails if metadata overwritten |
| File Carving | Recovers raw content | No filenames or paths |
12.4 Limitations & Anti-Forensics
🚫 Why Recovery Sometimes Fails
- Data overwritten
- Disk encryption enabled
- SSD TRIM command executed
- Secure wiping tools used
🕵️ Anti-Forensic Techniques
- File wiping utilities
- Disk defragmentation
- Repeated overwriting
- Encryption & obfuscation
12.5 Legal Considerations & Evidence Validation
⚖️ Court Acceptance of Recovered Files
- Forensic image must be validated
- Recovery process documented
- Hash values generated
- Chain of custody maintained
📋 Reporting Requirements
- Original file state
- Recovery method used
- File integrity status
- Limitations explained
Recovered data is evidence — not proof — until validated and correlated.
Deleted Partition Recovery Techniques
Partition deletion is often used to hide or destroy large volumes of data. This module explains how disk partitions are structured, what happens when partitions are deleted, and how forensic investigators recover deleted or hidden partitions without compromising evidence integrity. You will also learn about MBR, GPT, partition tables, and common anti-forensic tactics.
Deleting a partition usually removes metadata, not the data itself.
13.1 Disk Partitions & Partition Tables
📂 What is a Partition?
A partition is a logical division of a physical disk that allows operating systems to organize and manage data. Each partition typically contains its own file system.
🧱 Partition Tables
Partition tables store metadata describing where partitions start and end on a disk.
| Partition Table | Description | Forensic Notes |
|---|---|---|
| MBR (Master Boot Record) | Legacy partition scheme | Easy to overwrite |
| GPT (GUID Partition Table) | Modern partition scheme | Includes backup headers |
🔍 Forensic Value
- Partition tables reveal disk history
- Deleted partitions may still be identifiable
- Hidden partitions often contain sensitive data
13.2 What Happens When a Partition is Deleted?
🗑️ Logical Partition Deletion
When a partition is deleted, the operating system removes its entry from the partition table. The actual data blocks remain intact until overwritten.
📉 Effects of Partition Deletion
- File system becomes inaccessible
- Partition entry marked as unused
- Data remains physically present
🧠 Why Investigators Can Recover Partitions
- Partition boundaries still exist
- Boot sectors may remain intact
- File system signatures still present
13.3 Partition Recovery Techniques
🔬 Metadata-Based Recovery
This technique reconstructs partitions by analyzing remaining partition table data and backup headers.
🔍 Signature-Based Scanning
Investigators scan the disk for known file system signatures (NTFS, EXT, FAT) to identify deleted partitions.
| Technique | Strength | Limitation |
|---|---|---|
| Partition Table Recovery | Restores structure | Fails if overwritten |
| Signature Scanning | Finds unknown partitions | Cannot recover names |
13.4 Hidden Partitions & Anti-Forensics
🕵️ Hidden Partitions
Hidden partitions are intentionally concealed to prevent detection by the operating system.
🚫 Anti-Forensic Techniques
- Overwriting partition tables
- Creating fake partition entries
- Using encryption on partitions
- Altering disk geometry
🔍 Forensic Indicators
- Mismatch between disk size and partitions
- Unallocated space with file system signatures
- Broken or inconsistent headers
13.5 Legal Considerations & Court Presentation
⚖️ Legal Validity of Recovered Partitions
- Acquisition must be forensic
- Partition recovery steps documented
- Hash verification required
- Chain of custody maintained
📋 Reporting Requirements
- Original disk state
- Partition table analysis
- Recovery method used
- Limitations clearly stated
Partition recovery often exposes the most deliberate attempts to hide or destroy digital evidence.
🎓 Module 13 : Deleted Partition Recovery Techniques Successfully Completed
You have successfully completed this module of Cyber Forensics Investigation.
Keep building your expertise step by step — Learn Next Module →
Forensics Investigations Using FTK (Forensic Toolkit)
FTK (Forensic Toolkit) is a comprehensive digital forensics platform developed by AccessData (now Exterro). It is widely used by law enforcement, corporate investigators, government agencies, and forensic labs worldwide for evidence acquisition, processing, analysis, and reporting. This module provides an in-depth exploration of FTK's architecture, features, workflows, and best practices.
FTK is designed to process massive amounts of data efficiently while maintaining forensic integrity and legal admissibility.
14.1 FTK Overview & Architecture
🔍 What is FTK (Forensic Toolkit)?
Forensic Toolkit (FTK) is an enterprise-grade digital forensics platform that enables investigators to process, analyze, and report on digital evidence from computers, mobile devices, and cloud sources. It is known for its speed, scalability, and comprehensive artifact parsing.
🏗️ FTK Architecture Overview
FTK follows a modular, client-server architecture designed for enterprise-scale investigations. The architecture consists of several key components that work together to process and analyze evidence efficiently.
📊 FTK Architecture Diagram
┌─────────────────────────────────────────────────────────────────────────────────────────────┐
│                              FTK ARCHITECTURE OVERVIEW                                       │
├─────────────────────────────────────────────────────────────────────────────────────────────┤
│                                                                                             │
│  ┌─────────────────────────────────────────────────────────────────────────────────────┐   │
│  │                           FTK PROCESSING ENGINE                                       │   │
│  │  ┌─────────────┐  ┌─────────────┐  ┌─────────────┐  ┌─────────────┐                │   │
│  │  │   Evidence  │  │   File      │  │   Registry  │  │   Email     │                │   │
│  │  │   Processor │  │   Parser    │  │   Parser    │  │   Parser    │                │   │
│  │  └─────────────┘  └─────────────┘  └─────────────┘  └─────────────┘                │   │
│  │  ┌─────────────┐  ┌─────────────┐  ┌─────────────┐  ┌─────────────┐                │   │
│  │  │   Carving   │  │   Hash      │  │   Indexing  │  │   Timeline  │                │   │
│  │  │   Engine    │  │   Analysis  │  │   Engine    │  │   Generator │                │   │
│  │  └─────────────┘  └─────────────┘  └─────────────┘  └─────────────┘                │   │
│  └─────────────────────────────────────────────────────────────────────────────────────┘   │
│                                              │                                              │
│                                              ▼                                              │
│  ┌─────────────────────────────────────────────────────────────────────────────────────┐   │
│  │                           FTK DATABASE (SQL Server)                                  │   │
│  │  ┌─────────────┐  ┌─────────────┐  ┌─────────────┐  ┌─────────────┐                │   │
│  │  │   Case      │  │   File      │  │   Index     │  │   Bookmark  │                │   │
│  │  │   Metadata  │  │   Metadata  │  │   Data      │  │   Data      │                │   │
│  │  └─────────────┘  └─────────────┘  └─────────────┘  └─────────────┘                │   │
│  └─────────────────────────────────────────────────────────────────────────────────────┘   │
│                                              │                                              │
│                                              ▼                                              │
│  ┌─────────────────────────────────────────────────────────────────────────────────────┐   │
│  │                           FTK EXAMINER (GUI)                                         │   │
│  │  ┌─────────────┐  ┌─────────────┐  ┌─────────────┐  ┌─────────────┐                │   │
│  │  │   File      │  │   Search    │  │   Filter    │  │   Report    │                │   │
│  │  │   Explorer  │  │   Engine    │  │   Manager   │  │   Generator │                │   │
│  │  └─────────────┘  └─────────────┘  └─────────────┘  └─────────────┘                │   │
│  └─────────────────────────────────────────────────────────────────────────────────────┘   │
│                                                                                             │
└─────────────────────────────────────────────────────────────────────────────────────────────┘
🧩 FTK Core Components
1. FTK Processing Engine
The backend processing service that handles evidence ingestion, parsing, indexing, and carving. It runs as a Windows service and can process multiple evidence sources simultaneously.
- Multi-threaded processing for speed
- Supports distributed processing across multiple machines
- Automatic artifact extraction and categorization
2. FTK Database (SQL Server)
Central repository for all case data, including file metadata, indexes, bookmarks, and analysis results. Uses Microsoft SQL Server (Express or Enterprise).
- Scalable to millions of files
- Full-text indexing for fast searches
- Supports network-based shared cases
3. FTK Examiner (GUI)
The user interface for investigators to review evidence, conduct searches, bookmark findings, and generate reports.
- Intuitive file explorer interface
- Advanced filtering and sorting
- Built-in viewers for hundreds of file types
4. FTK Connect
Distributed processing module that allows multiple FTK Processing Engines to work on the same case simultaneously.
- Load balancing across servers
- Reduced processing time for large cases
- Enterprise-scale investigations
- FTK (Standard): Single-user desktop version for individual examiners
- FTK Enterprise: Multi-user, distributed processing for large teams
- FTK Lab: High-volume processing for forensic laboratories
- FTK Central: Web-based review and collaboration platform
14.1.1 FTK Components & Modules
📦 FTK Processing Modules
| Module | Function | Forensic Value |
|---|---|---|
| File System Parser | Parses NTFS, FAT, exFAT, EXT, HFS+, APFS | Recovers deleted files, slack space, alternate data streams |
| Registry Parser | Extracts and analyzes Windows Registry hives | USB history, program execution, user accounts, network settings |
| Email Parser | Parses PST, OST, MSG, EML, MBOX files | Email headers, attachments, deleted emails, calendar items |
| Internet Artifact Parser | Extracts browser history, cache, cookies, downloads | User web activity, search queries, downloaded files |
| Carving Engine | Recovers files based on file signatures | Recovers deleted files when metadata is missing |
| Hash Analysis Module | Compares file hashes against known databases (NSRL) | Identifies known good (OS files) and known bad (malware) files |
| Indexing Engine | Creates full-text searchable index of all files | Enables fast keyword searching across terabytes of data |
| Timeline Generator | Creates chronological event timelines | Visualizes user and system activity over time |
🛠️ FTK Examiner Interface Components
File Explorer
Tree-view navigation of evidenceGallery View
Thumbnail preview of imagesSearch Panel
Advanced search interfaceFilter Manager
Custom filtering and taggingReport Viewer
Built-in report generationTimeline View
Event timeline visualizationEmail View
Email threading and analysisRegistry View
Registry hive browser14.1.2 FTK System Requirements & Installation
💻 Minimum System Requirements
| Component | Minimum | Recommended |
|---|---|---|
| Operating System | Windows 10 Pro/Enterprise (64-bit) | Windows Server 2019/2022 or Windows 11 Pro |
| Processor | Intel Core i5 (4 cores) | Intel Core i7/i9 or Xeon (8+ cores) |
| RAM | 16 GB | 32-64 GB (or more for large cases) |
| Storage | 500 GB free space | 1-2 TB SSD (or separate RAID for evidence) |
| Database | SQL Server Express (10 GB limit) | SQL Server Standard/Enterprise |
| Graphics | DirectX 10 compatible | Dedicated GPU for 3D visualization |
📥 FTK Installation Steps
- Download FTK Installer from Exterro customer portal
- Install SQL Server (Express, Standard, or Enterprise)
- Run FTK Installer as Administrator
- Select Components to install:
- FTK Processing Engine
- FTK Examiner (GUI)
- FTK Database (creates FTK database)
- FTK Connect (optional, for distributed processing)
- Configure Database Connection (server name, authentication)
- Configure Processing Engine (worker threads, temp folders)
- Complete Installation and reboot if required
- Activate License using license key or dongle
- Apply Latest Updates and service packs
14.2 Creating a Forensic Case in FTK
📂 Case Creation Workflow
A forensic case in FTK is a container that holds all evidence, processing results, bookmarks, and reports for a specific investigation. Proper case management ensures organization and legal defensibility.
📋 Step-by-Step Case Creation
- Launch FTK Examiner
- Click File → New → Case or press Ctrl+N
- Enter Case Information:
- Case Name: Unique identifier for the case
- Case Number: Internal or external case reference
- Examiner Name: Lead forensic examiner
- Description: Brief summary of the investigation
- Case Folder: Location where case data will be stored
- Click Next to configure processing options
- Select Processing Profile (Default, Quick, Deep, Custom)
- Click Finish to create the case
⚙️ Processing Profiles
| Profile | Description | Best For |
|---|---|---|
| Quick Processing | Minimal processing – file system only | Initial triage, small cases |
| Default Processing | Standard processing – files, registry, email, indexing | Most investigations (balanced) |
| Deep Processing | Full processing including carving and deep parsing | Complex cases, data recovery, thorough analysis |
| Custom Profile | User-defined processing options | Specialized investigations |
14.2.1 Evidence Sources & Acquisition
📥 Supported Evidence Sources
💾 Disk Images
- E01 (EnCase Evidence File)
- RAW/DD (bit-for-bit images)
- AFF (Advanced Forensic Format)
- VMDK, VHD, VHDX
- E01 split files (.E01, .E02, etc.)
💻 Physical Devices
- Local physical drives (with write blocker)
- USB drives and removable media
- Memory cards (SD, MicroSD)
- SSD and NVMe drives
📁 Logical Evidence
- Folders and files
- Email containers (PST, OST, MSG)
- Cloud exports (Google Takeout, etc.)
- Mobile device backups
📤 Adding Evidence to a Case
- Open your case in FTK Examiner
- Click File → Add Evidence or the Add Evidence toolbar button
- Select evidence type:
- Image File: For forensic images (E01, RAW, AFF)
- Physical Drive: For live drives (requires write blocker)
- Logical Drive/Folder: For files and folders
- Email Container: For PST/OST files
- Browse to the evidence location
- Enter Evidence Information (Evidence ID, description)
- Click Add to add to processing queue
- Repeat for additional evidence sources
- Click Process to start evidence processing
14.2.2 Evidence Processing & Indexing
⚙️ FTK Processing Workflow
File System
ParsingHash
AnalysisRegistry
ParsingIndexing
Full-TextCarving
Recovery📊 Processing Options Explained
| Option | Description | Impact on Time |
|---|---|---|
| File System Parsing | Extracts file metadata, directory structure, deleted files | Low to Medium |
| Hash Analysis | Calculates MD5/SHA1/SHA256, compares to KFF | Low (depends on file count) |
| Registry Parsing | Extracts Windows Registry artifacts | Low |
| Email Parsing | Processes PST, OST, MSG files | Medium to High |
| Full-Text Indexing | Creates searchable index of file contents | High (significant time and storage) |
| Data Carving | Recovers files based on signatures | Very High (can double processing time) |
14.2.3 Hash Analysis & Known File Filtering (KFF)
🔐 What is KFF?
Known File Filtering (KFF) is a feature in FTK that identifies files based on their cryptographic hash values. It allows investigators to:
- Flag known good files (OS files, common applications) to exclude from review
- Flag known bad files (malware, contraband) for priority review
- Identify duplicate files across evidence sources
- Verify evidence integrity by comparing hash values
📊 Hash Databases Supported by FTK
| Database | Description | Use Case |
|---|---|---|
| NSRL (National Software Reference Library) | Over 200 million known software file hashes | Exclude known OS and application files |
| HashKeeper | FBI's hash database for contraband | Flag known illegal content |
| Custom Hash Sets | User-created hash lists | Case-specific known files or evidence |
| Case KFF | Automatically created from case files | Identify duplicate files within case |
⚙️ Configuring KFF in FTK
- Open Tools → Options → KFF
- Click Add Database to load NSRL or custom hash sets
- Select hash algorithms to use (MD5, SHA-1, SHA-256)
- Configure Hash Set Types:
- Known Good: Files to exclude from review
- Known Bad: Files to flag for priority review
- Alert: Files requiring immediate attention
- Apply KFF during processing or re-process evidence
14.3 File System Analysis in FTK
📁 Navigating the File Explorer
FTK's File Explorer provides a familiar tree-view interface for browsing evidence, similar to Windows Explorer but with forensic capabilities. Key features include:
📂 Directory Tree
Hierarchical view of file system showing all directories and files, including deleted items (strikethrough).
📋 File List View
Detailed file listing with sortable columns: Name, Path, Size, Modified Date, Accessed Date, Created Date, Hash Values.
🖼️ Gallery View
Thumbnail preview of image files for rapid visual scanning.
🔍 Viewing Deleted Files
FTK displays deleted files with a red strikethrough in the file list. Deleted files can be:
- Recovered - If the content hasn't been overwritten
- Partially Recovered - If only fragments remain
- Unrecoverable - If content has been overwritten
📊 File Category Filters
FTK automatically categorizes files for easier filtering and review:
| Category | Examples | Forensic Relevance |
|---|---|---|
| Documents | PDF, DOCX, XLSX, PPTX, TXT | User-generated content, evidence |
| Images | JPEG, PNG, GIF, BMP, TIFF | Photos, screenshots, contraband |
| Audio/Video | MP3, MP4, WAV, AVI, MKV | Recordings, evidence files |
| Archives | ZIP, RAR, 7z, TAR, GZ | Compressed evidence, hidden data |
| Executables | EXE, DLL, MSI, SYS, COM | Malware, software, tools |
| Databases | SQLite, MDB, ACCDB | Structured data, application data |
14.3.1 Deleted File Recovery & Carving
🗑️ How FTK Recovers Deleted Files
FTK uses two primary methods to recover deleted files:
1. Metadata-Based Recovery
Uses file system metadata (MFT entries, inodes) to locate and recover deleted files.
- Preserves original filename
- Preserves timestamps (MACB)
- Preserves directory structure
- Requires metadata not overwritten
2. Signature-Based Carving
Scans raw disk sectors for known file headers and footers.
- Recovers files without metadata
- Works when metadata is overwritten
- May produce false positives
- No original filename or timestamps
⚙️ Configuring File Carving in FTK
- Open Case → Processing Options
- Navigate to Carving tab
- Select Enable File Carving
- Choose carving method:
- Intelligent Carving: Analyzes file system fragmentation
- Simple Carving: Signature-based only (faster)
- Select file types to carve (images, documents, archives, etc.)
- Set Minimum File Size to avoid carving tiny fragments
- Click OK and reprocess evidence
📊 Carving Success Rates by File Type
| File Type | Carving Success Rate | Notes |
|---|---|---|
| JPEG/JPEG | High (95%+) | Distinct headers/footers (FF D8 / FF D9) |
| PNG | High (90%+) | Distinct header (‰PNG) and chunk structure |
| Medium (70-80%) | Can be fragmented, footer may be missing | |
| ZIP | Medium (60-75%) | Central directory required for extraction |
| MP4/Video | Low (40-60%) | Complex structure, high fragmentation |
14.3.2 Registry Analysis in FTK
🔑 FTK Registry Viewer
FTK includes a powerful Registry Viewer that parses Windows Registry hives and presents artifacts in an organized, forensically meaningful way.
📋 Key Registry Artifacts Extracted by FTK
| Artifact | Registry Location | Forensic Value |
|---|---|---|
| USB Device History | HKLM\SYSTEM\CurrentControlSet\Enum\USBSTOR |
Shows all USB devices connected to the system |
| Program Execution (UserAssist) | NTUSER.DAT\Software\Microsoft\Windows\CurrentVersion\Explorer\UserAssist |
Tracks program execution count and last run time |
| Recent Documents | NTUSER.DAT\Software\Microsoft\Windows\CurrentVersion\Explorer\RecentDocs |
Recently accessed files |
| Network Shares (MRU) | NTUSER.DAT\Software\Microsoft\Windows\CurrentVersion\Explorer\Map Network Drive MRU |
Mapped network drives |
| Auto-start Programs | HKLM\SOFTWARE\Microsoft\Windows\CurrentVersion\Run |
Programs that run at startup (persistence) |
| Windows Installation Time | HKLM\SOFTWARE\Microsoft\Windows NT\CurrentVersion |
InstallDate - establishes system timeline |
| Last Logged-in User | HKLM\SOFTWARE\Microsoft\Windows\CurrentVersion\Authentication\LogonUI |
Last interactive user |
⚙️ Using FTK Registry Viewer
- In FTK Examiner, expand Registry in the navigation pane
- Select the registry hive to analyze (SYSTEM, SOFTWARE, SAM, NTUSER.DAT)
- Browse organized categories:
- USB History - All connected USB devices
- Program Execution - UserAssist data
- Network - Network settings and shares
- System Information - OS version, install date
- User Accounts - SAM database information
- Double-click any artifact to view details
- Right-click to bookmark or export registry data
14.3.3 Email & Internet Artifact Analysis
📧 Email Analysis in FTK
FTK's Email Parser extracts and organizes email data from multiple sources, providing a threaded view of conversations and extracting attachments.
| Email Source | Supported Formats | Extracted Data |
|---|---|---|
| Outlook | PST, OST | Emails, attachments, calendar, contacts, tasks, notes |
| Exchange/Outlook | MSG, EML | Individual email messages with headers |
| Webmail Exports | MBOX | Email archives from Thunderbird, Gmail Takeout |
🌐 Internet Artifact Analysis
FTK extracts and analyzes browser artifacts from major browsers:
🌐 Chrome/Chromium
- History (URLs, timestamps, visit count)
- Downloads (filenames, URLs, timestamps)
- Cookies (domains, values, expiration)
- Cache (cached files and resources)
- Bookmarks (saved URLs)
- Search queries (Google, etc.)
🦊 Firefox
- Places.sqlite (history, bookmarks)
- Downloads.sqlite (download history)
- Cookies.sqlite (cookie database)
- Cache (disk and memory cache)
- Form history (saved form data)
🔷 Internet Explorer/Edge
- History (index.dat / ESE database)
- Downloads (downloaded files list)
- Cookies (plain text cookie files)
- Cache (temporary internet files)
- Favorites (bookmarked URLs)
14.3.4 Timeline Analysis & Visualization
🕒 FTK Timeline View
FTK's Timeline View creates a visual, chronological representation of system and user activity, allowing investigators to:
- Identify sequences of events leading to an incident
- Correlate activities across different evidence sources
- Spot gaps or anomalies in activity patterns
- Present a clear narrative of events in court
📊 Timeline Visualization Features
📈 Granularity Controls
Zoom in/out from years to minutes to focus on relevant time periods.
🎨 Color-Coded Events
Different event types (file access, email, web browsing) are color-coded for easy identification.
🔍 Filtering
Filter by event type, file path, user account, or date range.
📋 Exportable
Export timeline data to CSV for further analysis or import into specialized tools like Plaso.
⚙️ Creating a Timeline in FTK
- In FTK Examiner, click View → Timeline
- Select Timeline Type:
- File System Timeline: MACB timestamps from files
- Event Timeline: Events from logs and artifacts
- Combined Timeline: Both file system and events
- Set Date Range (or use default range)
- Select Event Types to include (File Access, Email, Web, Registry, etc.)
- Click Generate Timeline
- Use mouse wheel to zoom, click and drag to pan
- Click on any event to view details in the bottom panel
- Right-click events to bookmark or export
14.4 Keyword Searching & Indexing
🔍 FTK Search Engine
FTK includes a powerful full-text search engine that indexes all text-based content (documents, emails, web pages, etc.) for rapid keyword searching across terabytes of data.
📋 Types of Searches in FTK
| Search Type | Description | Use Case |
|---|---|---|
| Index Search | Searches the full-text index | Fastest search, requires indexing during processing |
| Live Search | Searches files in real-time without index | Small cases or when indexing not performed |
| Regular Expression | Pattern-based searching | Finding patterns (SSN, credit cards, email addresses) |
| Case-Sensitive Search | Exact case matching | Finding specific terms with case sensitivity |
| Fuzzy Search | Finds similar words (typos, variations) | OCR text with errors, misspelled terms |
⚙️ Running an Index Search
- Click Search → Index Search or press Ctrl+F
- Enter search terms (supports AND, OR, NOT, parentheses)
- Select search options:
- Match case
- Match whole word
- Use regular expressions
- Search within: File names, File content, Both
- Select file categories to search (optional)
- Click Search
- Review results in the Search Results panel
- Double-click any result to view the file in context
- Bookmark relevant hits
("credit card" OR "creditcard") AND NOT "test"
14.4.1 Filtering & Bookmarking
🎯 Filter Manager
FTK's Filter Manager allows investigators to quickly narrow down the evidence set based on various criteria:
File Category
Images, Documents, Archives, etc.File Size
Range-based filteringDate Range
Modified, Accessed, CreatedHash Status
Known Good, Known Bad, AlertDeleted Status
Deleted, Active, BothOwner
File owner / user accountExtension
File extension filterName
Filename pattern matching🏷️ Bookmarking Evidence
Bookmarks allow investigators to tag and organize relevant evidence for later reference and inclusion in reports.
- Select files, emails, or registry entries in the evidence view
- Right-click and select Bookmark → Add to Bookmark
- Select an existing bookmark folder or create a new one
- Enter a description (e.g., "Suspicious image found in user's Downloads folder")
- Set Tag Color for visual identification
- Click OK to save the bookmark
- Evidence/ - Key evidence items
- Timeline/ - Important timeline events
- Suspect/ - Items attributed to suspect
- To Review/ - Items needing further analysis
- Report/ - Items to include in final report
14.4.2 Evidence Correlation & Link Analysis
🔗 Correlating Evidence Across Sources
FTK allows investigators to correlate evidence across multiple sources to build a complete picture of events:
📧 Email Threading
FTK automatically groups email conversations, showing the complete thread across multiple messages and mailboxes.
🌐 Web + Download Correlation
Correlates web browsing history with downloaded files, showing which URLs led to which files.
📁 File Relationships
Identifies relationships between files (e.g., email attachments, zip contents, embedded objects).
👤 User Attribution
Links file ownership and activity to specific user accounts via SID, ownership metadata, and registry artifacts.
🔍 Using FTK's Entity Extraction
FTK can automatically extract entities (names, email addresses, phone numbers, credit cards, SSNs) from text content for rapid identification of personally identifiable information (PII).
- Click Analysis → Entity Extraction
- Select entity types to extract:
- Email addresses
- Phone numbers
- Credit card numbers
- Social Security Numbers (US)
- Names
- Dates
- Click Extract
- View results in the Entity Extraction panel
- Click any entity to see all occurrences across the case
- Bookmark entities as evidence
attacker@malicious.com contains an attachment.
FTK can correlate the email, the attachment, and any subsequent file system activity related to that attachment.
14.5 Report Generation in FTK
📄 FTK Reporting Overview
FTK's reporting engine generates professional, court-ready reports that document the entire investigation process, findings, and conclusions. Reports can be customized to include case information, evidence inventory, bookmarks, search results, and timelines.
📋 Types of Reports in FTK
| Report Type | Description | Best For |
|---|---|---|
| Executive Summary Report | High-level overview with key findings | Management, legal teams, non-technical stakeholders |
| Technical Report | Detailed forensic findings with technical specifics | IT staff, forensic peer review, opposing experts |
| Legal/Court Report | Formal evidentiary report for legal proceedings | Courts, attorneys, expert testimony |
| Custom Report | User-defined content and format | Specialized reporting requirements |
⚙️ Generating a Report
- Click Report → Generate Report
- Select Report Template (Executive, Technical, Legal, or Custom)
- Select Bookmarks to include in the report
- Select Sections to include:
- Case Information
- Evidence Inventory
- Processing Summary
- Bookmarked Items
- Search Results
- Timeline
- Hash Analysis Results
- Examiner Notes
- Select Output Format:
- PDF (recommended for court)
- RTF (editable in Word)
- HTML (web viewable)
- CSV (data export)
- Click Generate
- Review and save the report
14.5.1 Custom Report Templates
📝 Creating Custom Report Templates
FTK allows investigators to create custom report templates for consistent, repeatable reporting across cases.
- Click Report → Report Templates → New
- Enter Template Name
- Select Base Template (start from existing)
- Configure Header/Footer (agency logo, case number, page numbers)
- Select Default Sections to include
- Configure Styling (fonts, colors, margins)
- Set Default Output Format
- Click Save
- Criminal_Investigation.ftkr - For law enforcement cases
- Internal_HR.ftkr - For employee investigations
- Data_Breach.ftkr - For incident response reports
- eDiscovery.ftkr - For litigation support
14.5.2 Exporting Evidence & Exhibits
📤 Exporting Files from FTK
FTK allows investigators to export files and artifacts as exhibits for inclusion in reports or for sharing with other parties.
| Export Type | Description | Format Options |
|---|---|---|
| Single File Export | Export individual files | Original format, RAW, PDF |
| Batch Export | Export multiple selected files | Original format, ZIP archive |
| Bookmark Export | Export all bookmarked items | Original format, PDF report | Registry Export | Export registry keys/values | REG, CSV, TXT |
| Timeline Export | Export timeline events | CSV, XLSX |
- Select files or bookmarks to export
- Right-click and select Export → Export Files
- Select Export Location
- Choose Export Options:
- Preserve folder structure
- Export as ZIP archive
- Generate hash manifest
- Include metadata file
- Click Export
- Document export in case notes (chain of custody)
14.6 FTK Connect & Distributed Processing
🌐 What is FTK Connect?
FTK Connect is a distributed processing module that allows multiple FTK Processing Engines to work on the same case simultaneously, dramatically reducing processing time for large cases.
📊 FTK Connect Architecture
┌─────────────────────────────────────────────────────────────────────────────┐
│                        FTK CONNECT ARCHITECTURE                              │
├─────────────────────────────────────────────────────────────────────────────┤
│                                                                             │
│  ┌─────────────────────────────────────────────────────────────────────┐   │
│  │                        FTK CASE DATABASE                             │   │
│  │                     (SQL Server - Central)                           │   │
│  └─────────────────────────────────────────────────────────────────────┘   │
│                                    │                                        │
│          ┌─────────────┬───────────┼───────────┬─────────────┐             │
│          ▼             ▼           ▼           ▼             ▼             │
│  ┌───────────┐  ┌───────────┐  ┌───────────┐  ┌───────────┐  ┌───────────┐ │
│  │ Processing│  │ Processing│  │ Processing│  │ Processing│  │ Processing│ │
│  │  Engine 1 │  │  Engine 2 │  │  Engine 3 │  │  Engine 4 │  │  Engine N │ │
│  │ (Worker)  │  │ (Worker)  │  │ (Worker)  │  │ (Worker)  │  │ (Worker)  │ │
│  └───────────┘  └───────────┘  └───────────┘  └───────────┘  └───────────┘ │
│                                                                             │
│  Benefits:                                                                  │
│  • Linear scaling - add workers to reduce processing time                   │
│  • Load balancing - automatic distribution of tasks                         │
│  • Fault tolerance - failed workers can be restarted                        │
│  • Centralized management - all workers managed from FTK Examiner           │
│                                                                             │
└─────────────────────────────────────────────────────────────────────────────┘
14.6.1 FTK Intella Integration
🔗 FTK + Intella = Complete Investigation
FTK integrates with Intella (Vound's email and document review platform) to provide enhanced eDiscovery and document review capabilities for large-scale investigations.
📧 Advanced Email Review
Intella provides superior email threading, deduplication, and review workflows for large email collections.
🤖 AI-Powered Categorization
Intella uses machine learning to automatically categorize documents as relevant/not relevant.
👥 Multi-User Review
Multiple reviewers can work on the same case simultaneously with Intella's web-based interface.
📊 Production-Ready Exports
Export reviewed documents in load-file format for litigation support.
14.6.2 Scripting & Automation with FTK
⚡ Automating Forensic Workflows
FTK supports scripting and automation through its API and command-line interface, allowing investigators to automate repetitive tasks and integrate FTK with other tools.
📋 Common Automation Use Cases
- Batch Processing: Process multiple cases automatically
- Custom Artifact Extraction: Extract specific artifacts across cases
- Automated Reporting: Generate standardized reports for multiple cases
- Integration: Connect FTK with SIEM, case management, or ticketing systems
- Data Export: Export specific data types on a schedule
💻 Command-Line Interface (CLI) Examples
# Process a case from command line
FTKProcess.exe /case:"C:\Cases\Case001" /evidence:"D:\Evidence\drive.E01"

# Export bookmarks to CSV
FTKExport.exe /case:"C:\Cases\Case001" /bookmarks:all /format:csv /output:"C:\Export"

# Generate report
FTKReport.exe /case:"C:\Cases\Case001" /template:"Legal" /output:"C:\Reports\Case001.pdf"

# Hash analysis on a file
FTKHash.exe /file:"C:\Evidence\suspicious.exe" /algorithm:SHA25614.7 FTK Best Practices
✅ FTK Best Practices Checklist
📋 Pre-Processing
- Verify evidence integrity with hash values before processing
- Use hardware write blockers for live evidence
- Document all case information before starting
- Allocate sufficient disk space for database and temp files
- Configure KFF before processing to save time
⚙️ During Processing
- Monitor processing logs for errors
- Document processing parameters and settings
- Use appropriate processing profile for case type
- Consider using FTK Connect for large cases
- Save processing state periodically
🔍 Analysis
- Start with timeline analysis to understand event sequence
- Use filtering to focus on relevant evidence
- Bookmark all relevant findings immediately
- Correlate evidence across multiple sources
- Document your analysis methodology
📄 Reporting
- Generate reports as you go (not just at the end)
- Include hash values for all exported evidence
- Document tool versions and settings
- Have another examiner peer-review your report
- Export evidence exhibits with hash manifests
14.7.1 Court Admissibility & Tool Validation
⚖️ FTK in the Courtroom
FTK is widely accepted in courts worldwide. However, examiners must be prepared to testify about:
- Their training and certification on FTK
- The version of FTK used and its validation status
- The processing parameters and settings applied
- How evidence integrity was maintained
- The chain of custody for all evidence
📋 Tool Validation Best Practices
| Validation Activity | Frequency | Documentation Required |
|---|---|---|
| Verify hash algorithm accuracy | Before each case or quarterly | Test results with known file hashes |
| Test carving functionality | Quarterly | Carve known files and verify recovery |
| Validate registry parsing | Quarterly | Compare FTK output with manual registry analysis |
| Test email parsing | Quarterly | Parse known PST and verify results |
| Validate FTK version after updates | After each update | Regression testing on previous cases |
- FTK's methodology has been tested and peer-reviewed
- The known error rate of FTK features (very low)
- FTK is generally accepted in the forensic community
- Your specific training and experience with FTK
14.7.2 Common FTK Mistakes to Avoid
❌ Mistake 1: Insufficient Disk Space
FTK requires significant disk space for the database and temporary files. Running out of space mid-processing corrupts the case.
Solution: Allocate 2-3x the size of evidence for the case folder.
❌ Mistake 2: Not Using KFF
Processing without KFF wastes time reviewing known good files (OS, applications).
Solution: Always load NSRL and configure KFF before processing.
❌ Mistake 3: Over-Processing
Enabling every processing option (including carving) on large cases can take weeks.
Solution: Start with Default or Quick profile, add carving only if needed.
❌ Mistake 4: Ignoring Processing Logs
Processing logs contain errors and warnings that may indicate evidence issues.
Solution: Review logs after each processing job and document findings.
❌ Mistake 5: Not Bookmarking as You Go
Waiting until the end to bookmark findings leads to missed evidence.
Solution: Bookmark immediately when you find relevant evidence.
❌ Mistake 6: Poor Documentation
Failing to document processing settings and methodology weakens court admissibility.
Solution: Save processing logs, document all settings, use case notes.
🎓 Module 14 : Forensics Investigations Using FTK Successfully Completed
You have successfully completed this module of Cyber Forensics Investigation.
Keep building your expertise step by step — Learn Next Module →
Forensics Investigations Using Oxygen (Oxygen Forensic® Detective)
Oxygen Forensic® Detective is a leading mobile and cloud forensic investigation platform used by law enforcement, corporate investigators, and digital forensic laboratories worldwide. This module explains how Oxygen acquires, processes, analyzes, and reports evidence from mobile devices, applications, cloud services, and backups while maintaining strict forensic and legal standards.
Smartphones often contain more evidence than computers.
15.1 Overview of Oxygen & Forensic Architecture
📱 What is Oxygen Forensic Detective?
Oxygen Forensic® Detective is a specialized digital forensics suite designed primarily for the extraction and analysis of mobile device data, application artifacts, and cloud backups.
🏗️ Oxygen Architecture
- Data Acquisition Layer – Device & cloud extraction
- Decoder Engine – App & database parsing
- Analytics Module – Timeline, social graphs
- Reporting Engine – Court-ready documentation
🔍 Evidence Sources Supported
- Android devices
- iOS devices
- Cloud backups (iCloud, Google)
- Application databases
- IoT & wearable data (supported cases)
15.2 Mobile Data Acquisition Methods
📥 Types of Mobile Acquisition
- Logical Extraction – User-accessible data
- File System Extraction – App databases & files
- Physical Extraction – Full memory (supported devices)
📊 Data Acquired
- Contacts & call logs
- SMS, MMS & chats
- Photos, videos & audio
- Installed applications
- Location & GPS data
⚖️ Forensic Integrity
- Read-only acquisition
- Hash verification
- Device metadata preservation
- Chain of custody documentation
15.3 Application & Messaging App Analysis
💬 App-Level Forensics
Oxygen excels at decoding and analyzing data from popular messaging, social media, and communication applications.
📱 Common App Artifacts
- Chat messages
- Attachments & media
- Deleted messages (where available)
- Account identifiers
- Timestamps & metadata
🔍 Deleted & Hidden Data
- SQLite database remnants
- Cache & temp files
- Backup copies
15.4 Timeline, Geolocation & Social Graph Analysis
🕒 Timeline Analysis
Oxygen automatically correlates events from multiple apps to generate a unified activity timeline.
📍 Geolocation Evidence
- GPS coordinates
- Wi-Fi & cell tower data
- Photo EXIF location data
🧠 Social Graphs
Social graph analysis visually represents relationships between users, contacts, and communication patterns.
15.5 Reporting, Validation & Court Presentation
📄 Oxygen Reports
Oxygen generates structured forensic reports that are widely accepted in courts and internal investigations.
📋 Report Components
- Case overview
- Device & acquisition details
- Hash values
- Decoded artifacts
- Timelines & visualizations
- Examiner notes
⚖️ Legal Defensibility
- Repeatable extraction
- Tool credibility
- Evidence integrity validation
- Clear methodology
Oxygen transforms raw mobile data into clear, defensible digital evidence.
Forensics Investigations Using EnCase
EnCase is one of the most trusted and widely accepted digital forensic investigation platforms in the world. It is used extensively by law enforcement, government agencies, corporate investigators, and courts. This module explains how EnCase handles evidence acquisition, deep file system analysis, artifact examination, automation, and court-ready reporting.
Many courts explicitly recognize EnCase-based forensic analysis.
16.1 Overview of EnCase & Forensic Architecture
🧰 What is EnCase?
EnCase is a comprehensive digital forensics suite designed to acquire, analyze, and report on digital evidence while preserving strict forensic integrity. It supports disk forensics, memory analysis, file system examination, and artifact correlation.
🏗️ EnCase Architecture
- Evidence Processor – Parses data & metadata
- Case Database – Stores findings & indexes
- Viewer Modules – File, hex, registry, email
- EnScript Engine – Automation & customization
- Reporting Engine – Legal documentation
🔍 Supported Evidence Types
- Disk images (E01, RAW, AFF)
- Logical files & folders
- Memory images
- Mobile & removable media
- Network & external storage artifacts
16.2 Case Creation, Evidence Acquisition & Validation
📂 Case Creation in EnCase
Each EnCase case represents a complete investigation. It includes evidence sources, examiner notes, processing details, and reporting data.
📥 Evidence Acquisition
- Disk imaging using write blockers
- Logical evidence acquisition
- Memory acquisition (supported scenarios)
🔐 Evidence Validation
- Pre-acquisition hashing
- Post-acquisition hashing
- Automatic integrity verification
16.3 File System, Registry & Artifact Analysis
📁 File System Analysis
EnCase allows investigators to examine file systems at both logical and physical levels, including allocated, deleted, and hidden data.
🔍 Key Artifacts Examined
- Deleted files & folders
- Slack & unallocated space
- Recycle Bin contents
- Alternate Data Streams (ADS)
🧠 Windows Registry Forensics
- User login & profile history
- USB device connections
- Installed & executed programs
- Persistence mechanisms
16.4 EnScript Automation & Advanced Analysis
🧩 What is EnScript?
EnScript is EnCase’s scripting language that allows investigators to automate tasks, customize workflows, and perform repeatable analysis.
⚙️ EnScript Use Cases
- Automated artifact extraction
- Custom timeline generation
- Bulk file classification
- Advanced data parsing
🔍 Evidence Correlation
EnCase allows investigators to correlate file system activity, registry changes, logs, and user artifacts to establish intent and behavior.
16.5 Reporting, Courtroom Use & Legal Defensibility
📄 EnCase Reports
EnCase generates structured forensic reports that meet legal and corporate investigation standards.
📋 Report Components
- Case overview & scope
- Evidence sources & hash values
- Methodology & tools used
- Findings & exhibits
- Examiner conclusions
⚖️ Court Acceptance
- Repeatable forensic process
- Verified evidence integrity
- Industry-recognized tool credibility
- Clear documentation
EnCase transforms technical findings into legally defensible digital evidence.
Steganography & Image File Forensics
Steganography is the practice of hiding secret information within ordinary, non-secret files or messages to avoid detection. This module provides a comprehensive deep dive into steganography techniques, image file forensics, steganalysis, detection tools, and real-world applications. Understanding these concepts is essential for forensic investigators to identify hidden evidence, detect covert communications, and uncover malicious activities.
Steganography hides the existence of communication, while encryption only hides the content.
17.1 What is Steganography?
🔍 Definition of Steganography
Steganography (from Greek: στεγανός - steganos meaning "covered" or "concealed" + γράφω - graphia meaning "writing") is the practice of hiding secret information within a non-secret file or message in a way that avoids detection.
📌 Key Terminology
- Carrier / Cover File: The innocent-looking file (image, audio, video) used to hide secret data
- Payload: The secret data being hidden (text, image, file, etc.)
- Stego Key: An optional password or key used to encrypt the payload before embedding
- Stego File: The carrier file after the secret data has been embedded
- Channel: The medium used to transmit the stego file
- Embedding Algorithm: The mathematical method used to hide data
🎯 Primary Objectives
- Concealment: Hide the very existence of communication
- Covert Communication: Exchange secret messages without detection
- Data Exfiltration: Extract sensitive data from secure environments
- Anti-Forensics: Evade security controls and forensic tools
- Watermarking: Embed copyright or ownership information
- Anonymity: Protect the identity of communicating parties
🔬 How Steganography Works - The Basic Process
Secret Message
PayloadCover File
CarrierStego Key
(Optional)Stego File
Hidden Message17.2 History of Steganography
- Histiaeus (500 BC): Tattooed secret messages on a slave's shaved head. After hair grew back, the slave was sent with the message.
- Wax Tablets: Ancient Greeks and Romans wrote messages on wood, then covered with wax. The hidden message was revealed by removing the wax.
- Invisible Ink: Romans used milk, urine, and fruit juices as invisible ink that appeared when heated.
- Steganography in China: Messages hidden inside silk balls, wax seals, and even inside eggs.
- WWI - Microdots: German spies used microdots - photographs the size of a period that contained pages of text.
- WWII - Null Ciphers: Messages hidden within innocent-looking letters (e.g., "The dog is not eating today" might hide "The attack is at dawn").
- WWII - Invisible Ink: Both Allies and Axis powers used invisible ink for espionage communications.
- Prisoner's Dilemma: Prisoners used hidden messages in letters to communicate.
- 1992: First documented digital image steganography using LSB (Least Significant Bit).
- 1996: "Hide & Seek" - First publicly available steganography tool.
- 1999: Steganography detection (steganalysis) becomes an academic field.
- 2000: JSteg and JPHide - Popular JPEG steganography tools.
- 2001: 9/11 attacks - Reports suggested terrorists used steganography to communicate.
- 2010: Stuxnet worm - Used steganography to hide its payload and evade detection.
- 2015: ISIS and terrorist groups reportedly use steganography on social media.
- 2020s: AI-based steganography and deepfake detection.
17.3 Steganography vs Cryptography vs Digital Watermarking
| Feature | Steganography | Cryptography | Digital Watermarking |
|---|---|---|---|
| Primary Goal | Hide existence of message | Hide content of message | Protect ownership/copyright |
| Visibility | No one knows message exists | Encrypted data is visible (ciphertext) | Watermark is invisible but detectable |
| Detection | Difficult to detect without analysis | Easy to detect (ciphertext is obvious) | Requires specific reader/software |
| Attack Vulnerability | Image manipulation, compression, cropping | Brute force, cryptanalysis, side-channel | Cropping, scaling, compression, removal attacks |
| After Successful Attack | Secret message may be lost or corrupted | Message becomes readable (decryption) | Watermark may be removed or damaged |
| Key Requirement | Optional stego key | Required encryption key | May require secret key for extraction |
| Legal Status | Legally grey - often considered suspicious | Legal - widely used for privacy | Legal - used for DRM and copyright |
Cryptography First
Encrypt the secret message to protect its content, then hide it using steganography.
Steganography Second
Hide the encrypted payload inside a carrier file to conceal its existence.
Maximum Security
Even if steganography is detected, the payload remains encrypted and unreadable.
17.4 Types of Steganography
Image Steganography
Hide data in images using LSB, DCT, palette modification, or transform domain techniques.
Capacity: High (up to 30% of image size)
Detection: Moderate to difficult
Audio Steganography
Hide data in audio files using LSB, echo hiding, phase coding, or spread spectrum.
Capacity: Medium
Detection: Difficult to detect by ear
Video Steganography
Hide data in video frames or compression algorithms (I-frames, P-frames, B-frames).
Capacity: Very High
Detection: Very difficult
Text Steganography
Hide data using whitespace, line shifting, character encoding, or formatting.
Capacity: Low
Detection: Easy if visible
Network Steganography
Hide data in network protocols (TCP/IP headers, timing, sequence numbers).
Capacity: Low per packet
Detection: Very difficult
File System Steganography
Hide data in slack space, Alternate Data Streams (ADS), or bad blocks.
Capacity: Low to Medium
Detection: Moderate with forensic tools
17.5 Least Significant Bit (LSB) Steganography
🔬 What is LSB Steganography?
LSB steganography is the most common and simplest technique where the least significant bits of each pixel's color values are replaced with bits of the secret message. The change is imperceptible to the human eye.
🎨 How LSB Works in Images
In an RGB image, each pixel has three 8-bit values (Red, Green, Blue). The least significant bits have minimal impact on the visible color. Changing the LSB from 0 to 1 or 1 to 0 changes the color value by only 1/255, which is invisible to human perception.
┌─────────────────────────────────────────────────────────────────────────────────┐
│                    LSB STEGANOGRAPHY EXAMPLE                                    │
├─────────────────────────────────────────────────────────────────────────────────┤
│                                                                                 │
│  Original Pixel (Red channel):    10110100  (180 decimal)                      │
│  Secret Bit to hide:              1                                            │
│  Modified Pixel:                   10110101  (181 decimal)  ← Only 1 LSB changed!│
│                                                                                 │
│  Original Pixel (Green channel):  01101011  (107 decimal)                      │
│  Secret Bit to hide:              0                                            │
│  Modified Pixel:                   01101010  (106 decimal)  ← Only 1 LSB changed!│
│                                                                                 │
│  Original Pixel (Blue channel):   11001101  (205 decimal)                      │
│  Secret Bit to hide:              1                                            │
│  Modified Pixel:                   11001101  (205 decimal)  ← No change!       │
│                                                                                 │
│  VISUAL DIFFERENCE: The human eye CANNOT distinguish between 180 and 181!      │
└─────────────────────────────────────────────────────────────────────────────────┘
📊 LSB Capacity Calculation
| Image Resolution | Total Pixels | LSB Capacity (1 bit/pixel/channel) | Hidden Text Equivalent |
|---|---|---|---|
| 800 × 600 | 480,000 pixels | 480,000 bytes (468 KB) | ~480 pages of text |
| 1920 × 1080 (Full HD) | 2,073,600 pixels | 2,073,600 bytes (2 MB) | ~2,000 pages of text |
| 3840 × 2160 (4K) | 8,294,400 pixels | 8,294,400 bytes (8.3 MB) | ~8,300 pages of text |
| 7680 × 4320 (8K) | 33,177,600 pixels | 33,177,600 bytes (33 MB) | ~33,000 pages of text |
⚡ LSB Steganography Process
Convert secret message to binary bits
Read pixel color values (RGB)
Replace LSB of each channel with secret bits
Save modified image (appears unchanged)
🔍 Variations of LSB Steganography
1-bit LSB
Uses only the last bit of each color channel. Capacity = pixels × 3 bits. Most common.
2-bit LSB
Uses the last 2 bits of each channel. Capacity doubled but more visible.
Randomized LSB
Uses a stego key to randomly select which pixels to modify. Harder to detect.
Sequential LSB
Modifies pixels in order from top-left to bottom-right. Easy to implement.
LSB in Specific Channels
Only modifies specific color channels (e.g., only blue channel).
LSB Matching
Adds or subtracts 1 from the pixel value based on secret bit. Harder to detect.
- Creates statistical anomalies detectable using chi-square analysis
- Changes the color distribution of the image
- Can be detected by histogram analysis
- Tools like StegDetect and StegExpose can identify LSB steganography
# Python example using stegano library
from stegano import lsb

# Hide a secret message
secret = "The treasure is buried under the old oak tree"
lsb.hide("cover_image.png", secret).save("stego_image.png")

# Extract the hidden message
revealed = lsb.reveal("stego_image.png")
print(revealed)  # Output: The treasure is buried under the old oak tree
17.6 Image Steganography Techniques
Replace LSB bits with secret data bits. Simple, high capacity, but statistically detectable.
Cons: Detectable via steganalysis, vulnerable to compression
Used in JPEG compression. Hide data in frequency coefficients. More robust than LSB.
Cons: Lower capacity, more complex
For indexed color images (GIF, 8-bit PNG). Hide data by modifying or sorting color palette entries.
Cons: Limited capacity, visible palette changes
Hide data in visible parts of the image (watermark-style). Similar to digital watermarking.
Cons: Lower capacity, visible under close inspection
Hide data across the entire image using a pseudo-random noise pattern. Resistant to cropping.
Cons: Complex, lower capacity
Modify quantization indices in compressed images. Used in JPEG steganography.
Cons: Complex implementation
📊 Technique Comparison
| Technique | Capacity | Robustness | Detectability | Complexity |
|---|---|---|---|---|
| LSB Substitution | High | Low | High | Low |
| DCT-based | Medium | High | Medium | Medium |
| Spread Spectrum | Low | Very High | Low | High |
| Palette Modification | Low | Medium | Medium | Medium |
17.7 Audio Steganography
Audio steganography hides secret data within audio files. The human ear is less sensitive to small changes in audio than the eye is to changes in images, making audio a good carrier for hidden data.
🎵 Audio Steganography Techniques
Replace LSB of each audio sample with secret data bits. Similar to image LSB steganography.
Detection: Statistical analysis can detect anomalies
Hide data by adding tiny echoes to the audio signal. The echo amplitude and offset encode secret bits.
Detection: Difficult to detect by ear, cepstrum analysis can reveal
Modify the phase of audio signal components. Phase changes are imperceptible to human ear.
Detection: Very difficult, requires spectral analysis
Hide data across the entire frequency spectrum using pseudo-random noise.
Detection: Very difficult, requires knowledge of spreading sequence
📊 Audio Format Suitability
| Format | Suitability | Reason |
|---|---|---|
| WAV (Uncompressed) | Excellent | High quality, no compression artifacts, large capacity |
| FLAC (Lossless) | Good | Lossless compression preserves hidden data |
| MP3 (Lossy) | Moderate | Compression may destroy hidden data; special techniques required |
| AAC (Lossy) | Poor | High compression, aggressive psychoacoustic modeling |
# DeepSound features:
- Hide any file type inside audio
- Encrypt data before hiding
- Supports carrier audio files (WAV, FLAC)
- Password protection
- Can hide data in multiple audio files
17.8 Video Steganography
Video steganography combines image and audio steganography techniques. Video files have very high capacity because they consist of thousands of frames (images) plus audio tracks.
🎬 Video Steganography Approaches
Frame-based
Apply image steganography to each video frame independently. Highest capacity.
Audio-based
Hide data in the audio track of the video file.
Compression-based
Hide data in video compression parameters (I-frames, P-frames, B-frames, motion vectors).
📊 Video Steganography Capacity
| Video Quality | Resolution | Frames per Second | Duration (1 min) | Approx. Capacity |
|---|---|---|---|---|
| Standard | 640×480 | 30 | 1,800 frames | ~27 MB |
| HD | 1280×720 | 30 | 1,800 frames | ~86 MB |
| Full HD | 1920×1080 | 30 | 1,800 frames | ~195 MB |
| 4K | 3840×2160 | 30 | 1,800 frames | ~780 MB |
17.9 Text Steganography
Text steganography hides secret information within plain text documents, emails, web pages, or source code. It has the lowest capacity but is also the least suspicious.
📝 Text Steganography Techniques
Use spaces, tabs, and newlines to encode secret bits. Invisible to human readers.
Example: "Hello world" vs "Hello  world" (two spaces)
- Single space = 0
- Double space = 1Shift text lines up or down slightly to encode bits. Requires exact formatting.
Use homoglyphs (visually identical characters with different Unicode code points) to hide data.
Example: 'a' (U+0061) vs 'а' (U+0430 - Cyrillic)
Visually identical but different bytes!Modify the shape of letters (e.g., extending the top of 't') to encode data in printed documents.
📋 HTML/XML Steganography
| Technique | Example |
|---|---|
| Attribute Ordering | <img src="a.jpg" alt="text"> vs <img alt="text" src="a.jpg"> |
| Case Sensitivity | <DIV> vs <div> (HTML is case-insensitive) |
| Comment Hiding | <!-- Hidden message --> (visible in source code) |
17.10 Network/Protocol Steganography
Network steganography hides secret data within network protocols, making it extremely difficult to detect because the traffic appears normal to firewalls and IDS/IPS systems.
🌐 Network Steganography Techniques
Hide data in unused or rarely used header fields:
- IP Identification field (16 bits) - Can encode 2 bytes per packet
- TCP Sequence number (32 bits) - Can encode 4 bytes per packet
- TCP Acknowledgment number (32 bits) - Can encode 4 bytes per packet
- IP Options field - Up to 40 bytes per packet
Encode data in the timing of network packets:
- Inter-packet delays: Vary delays to encode bits
- Packet ordering: Reorder packets to encode data
- Packet loss patterns: Simulate loss to hide data
Hide data in DNS queries and responses:
- Subdomain labels: Encode data in subdomain names
- TXT records: Store arbitrary text in DNS TXT records
- DNS over HTTPS (DoH): Encrypts DNS traffic, hiding content
Example: secretdata.malicious.com
- "secretdata" is the encoded payload
- "malicious.com" is the C2 serverHide data in HTTP protocol elements:
- Cookie values: Encode data in session cookies
- User-Agent string: Modify browser string to encode bits
- URL parameters: Use meaningless parameters to hide data
- Header ordering: Change header order to encode data
- Traffic appears normal to standard security tools
- Encrypted protocols (HTTPS, DoH) hide content
- Covert channels can bypass firewalls
- Requires deep packet inspection and behavioral analysis
17.11 Image File Formats & Structure
Understanding image file structures is essential for forensic analysis. Different formats store data differently, affecting where and how hidden data can be placed.
- Structure: Header (SOI) → Segments (APP0, APP1, etc.) → SOS → Compressed image data → EOI
- Compression: Lossy (DCT + quantization)
- Forensic Value: High - can hide data in comment segments (COM), APP segments, or quantization tables
- Steganography: JSteg, JPHide, OutGuess, F5
- Structure: Signature → IHDR → IDAT chunks → IEND
- Compression: Lossless (DEFLATE)
- Forensic Value: Very High - supports custom ancillary chunks for hidden data
- Steganography: LSB in IDAT, hidden chunks, palette manipulation
- Structure: BITMAPFILEHEADER → BITMAPINFOHEADER → Color table → Pixel data
- Compression: None or RLE
- Forensic Value: Excellent - no compression, large capacity for LSB
- Steganography: LSB in pixel data, header manipulation
- Structure: Header → Logical Screen Descriptor → Global Color Table → Image Data
- Compression: LZW (lossless)
- Forensic Value: Medium - limited to 256 colors
- Steganography: Palette sorting, LSB in color table
📊 Image File Format Comparison
| Format | Compression | Color Depth | Steganography Capacity | Detection Difficulty |
|---|---|---|---|---|
| JPEG | Lossy | 24-bit | Medium | High |
| PNG | Lossless | 24/32-bit | High | Medium |
| BMP | None | 24-bit | Very High | Low |
| GIF | Lossless | 8-bit (256 colors) | Low | Medium |
- File size anomalies (too large for visible content)
- Unusual metadata or comment fields
- Appended data beyond the end-of-file marker
- Corrupted or non-standard headers
- Multiple IDAT chunks in PNG files
17.12 Image Metadata (EXIF, IPTC, XMP)
📸 What is Image Metadata?
Image metadata is "data about data" - additional information embedded within image files that describes how, when, and where the image was created, edited, and stored.
📸 EXIF (Exchangeable Image File Format)
Camera Information
- Make, Model, Serial Number
- Firmware Version
- Lens Information (make, model, focal length)
- Sensor type and size
Photo Settings
- Aperture (f-stop), Shutter Speed, ISO
- Focal Length, White Balance
- Flash Status, Exposure Mode
- Metering Mode, Focus Mode
GPS/Geolocation
- Latitude, Longitude (decimal degrees)
- Altitude (meters)
- Direction (bearing)
- GPS Timestamp (UTC)
- GPS Satellites used
Timestamps
- Date/Time Original (when photo was taken)
- Date/Time Digitized (when file was created)
- Date/Time Modified (last modification)
- Offset Time (timezone information)
🏷️ IPTC (International Press Telecommunications Council)
Standard metadata for news and media organizations, embedded in images:
- Creator/Byline: Photographer name
- Copyright Notice: Legal ownership statement
- Caption/Description: Image description
- Keywords: Searchable tags
- Headline: Brief title
- Credit Line: Attribution information
- Source: Original source of image
- Rights Usage Terms: Usage restrictions
🔖 XMP (Extensible Metadata Platform)
Adobe's metadata standard that extends beyond traditional EXIF/IPTC:
- Editing history (Photoshop/Lightroom changes)
- Rating and labels
- Creator contact information
- Rights management
- Custom metadata fields
- Hierarchical keywords
🛠️ Metadata Analysis Tools
| Tool | Platform | Features |
|---|---|---|
| ExifTool | Cross-platform (CLI) | Most comprehensive, read/write all metadata types |
| Metadata2Go | Web-based | Quick online analysis, supports multiple file types |
| Pic2Map | Web-based | GPS extraction and map visualization | Adobe Lightroom | Windows/Mac | View and edit XMP metadata |
17.13 Online Metadata Analysis Tools (Metadata2Go, Pic2Map)
Metadata2Go is a free online tool that extracts and displays metadata from various file types, including images, documents, audio files, and videos. It supports EXIF, IPTC, XMP, and other metadata standards.
🔧 Supported File Types
- JPEG / JPG
- PNG
- GIF
- BMP
- PDF documents
- Microsoft Office (DOCX, XLSX, PPTX)
- OpenDocument formats
- Audio files (MP3, WAV, FLAC)
- Video files (MP4, AVI)
- EPUB ebooks
⚡ How to Use
- Visit metadata2go.com
- Click "Choose File" or drag and drop your image
- Click "View Metadata" to analyze
- Review extracted metadata in organized tables
- Download metadata report (JSON, CSV, or HTML)
Pic2Map is a specialized online tool that extracts GPS coordinates from image metadata and displays them on an interactive map. It is particularly valuable for geolocation forensics.
🗺️ Key Features
- GPS coordinate extraction from EXIF data
- Interactive map display (Google Maps/OpenStreetMap)
- Address reverse lookup (coordinates → street address)
- Multiple format support (JPEG, PNG, TIFF, HEIC)
- Batch processing for multiple photos
- Export to KML/KMZ for Google Earth
⚡ How to Use
- Visit pic2map.com
- Upload image file (drag and drop or file picker)
- Tool automatically extracts GPS coordinates
- View exact location on interactive map
- Export location data for case documentation
- Verify alibis by checking photo locations
- Track suspect movements through geotagged photos
- Identify the camera/device used to take photos
- Detect metadata tampering or removal
- Establish timelines using timestamps
17.14 Image Tampering Detection
Error Level Analysis (ELA)
Detects JPEG compression inconsistencies caused by editing. Edited areas show different error levels.
Noise Analysis
Identifies different noise patterns from image splicing. Authentic images have consistent noise.
Lighting Analysis
Checks for inconsistent shadows, light sources, and reflections across the image.
Clone Detection
Identifies copy-move forgeries using feature matching (SIFT, SURF).
JPEG Ghost Detection
Reveals multiple compression histories indicating editing and resaving.
Deep Learning Detection
AI-based detection of sophisticated forgeries and deepfakes.
🛠️ Popular Tampering Detection Tools
| Tool | Purpose | Platform | Price |
|---|---|---|---|
| Forensically | ELA, Clone Detection, Noise Analysis | Web-based | Free |
| Amped Authenticate | Professional image authentication | Windows | Commercial |
| FotoForensics | ELA and metadata analysis | Web-based | Free |
| Ghiro | Automated image forensics | Linux/Web | Open Source |
| Izitru | Image authentication verification | Web-based | Free |
17.15 Image Forgery Analysis (Copy-Move, Splicing)
A region of the image is copied and pasted elsewhere to duplicate or hide objects.
Detection Methods:
- Block matching algorithms (lexicographical sorting)
- Scale-Invariant Feature Transform (SIFT)
- Speeded-Up Robust Features (SURF)
- Principal Component Analysis (PCA)
- DCT coefficient comparison
Multiple images are combined to create a composite forgery.
Detection Methods:
- Edge detection inconsistencies
- Noise pattern analysis
- Color filter array (CFA) artifacts
- Double JPEG compression detection
- Photo Response Non-Uniformity (PRNU)
🔬 Advanced Forgery Detection Techniques
| Technique | Description | Forensic Value |
|---|---|---|
| PRNU (Photo Response Non-Uniformity) | Camera sensor noise fingerprint unique to each device | Camera identification, forgery detection, device linking |
| DCT Coefficient Analysis | Examines JPEG compression artifacts | Detects double compression and tampering |
| Benford's Law | Statistical analysis of DCT coefficients | Detects digital manipulation and tampering |
| Metadata Correlation | Cross-references EXIF with image content | Identifies inconsistencies between metadata and content |
| Perspective Analysis | Checks vanishing points and perspective consistency | Detects spliced objects with wrong perspective |
📋 Forensic Workflow for Image Forgery Analysis
Preserve Original
Hash verificationExtract Metadata
EXIF/IPTC/XMPVisual Inspection
Different zoom levelsRun ELA
Error Level AnalysisNoise Analysis
Detect splicingClone Detection
SIFT/SURF analysisDocument
Report findings17.16 What is Steganalysis?
🕵️ Definition of Steganalysis
Steganalysis is the art and science of detecting hidden messages in digital media and determining whether a file contains steganographic content.
📊 Types of Steganalysis
Visual Steganalysis
Manual inspection of images for visual anomalies, artifacts, or suspicious patterns.
Cons: Time-consuming, misses subtle changes
Statistical Steganalysis
Uses statistical tests to detect deviations from expected distributions.
Cons: Requires statistical knowledge
Machine Learning Steganalysis
Uses AI/ML models trained on known stego and cover images.
Cons: Requires training data, computationally intensive
📋 Steganalysis Methodology
Collect
Suspicious filesExtract
FeaturesAnalyze
StatisticsDetect
AnomaliesExtract
Hidden dataReport
Findings17.17 Statistical Steganalysis
📊 What is Statistical Steganalysis?
Statistical steganalysis uses mathematical and statistical methods to detect anomalies in file properties that indicate the presence of hidden data. It is the most common and effective form of steganalysis.
🔬 Key Statistical Tests
1. Chi-Square (χ²) Test
Compares the expected frequency distribution of pixel values against the observed distribution. LSB steganography creates pairs of values (PoVs) that have nearly equal frequencies, detectable by chi-square.
Formula: χ² = Σ (Observed - Expected)² / Expected
If χ² is high → Likely contains hidden data
2. Histogram Analysis
Examines the distribution of pixel values or DCT coefficients. Steganography creates unnatural patterns in the histogram (step-like patterns for LSB, altered peaks for DCT-based).
3. RS (Regular/Singular) Analysis
Applies flipping functions to pixel groups. The ratio of regular to singular groups changes significantly when LSB steganography is present.
4. Sample Pair Analysis
Analyzes pairs of adjacent pixels. LSB embedding creates statistical relationships that can be measured and detected.
5. DCT Coefficient Analysis
For JPEG images, analyzes the distribution of DCT coefficients. Steganography alters the frequency of coefficients, creating detectable anomalies.
6. Wavelet Analysis
Uses wavelet transforms to analyze images at multiple scales. Hidden data creates statistical anomalies in wavelet coefficients.
🛠️ Statistical Steganalysis Tools
| Tool | Tests Performed | Target Format |
|---|---|---|
| StegDetect | Chi-square, RS analysis, Sample pairs | JPEG |
| StegSpy | Signature-based detection | Multiple formats |
| StegExpose | Multiple statistical tests | JPEG, PNG, BMP |
| Hiderman | Advanced statistical analysis | JPEG |
17.18 Visual Steganalysis
👁️ What is Visual Steganalysis?
Visual steganalysis is the manual inspection of images and files for visual anomalies that may indicate hidden data. While less reliable than statistical methods, it can be effective for certain types of steganography and requires no specialized tools.
🔍 What to Look For
⚠️ Visual Anomalies
- Unusual Color Patterns: Random-looking colors or artificial patterns in natural images
- Visible Noise: Grainy or noisy areas that seem out of place
- Block Artifacts: Visible block boundaries in JPEG images (indicates multiple compressions)
- Sharp Edges: Abrupt color changes that don't match natural image content
- Discolored Areas: Patches of image that have different color characteristics
✅ Inspection Techniques
- Zoom In: Examine images at 200-400% magnification
- Bit Plane Slicing: View individual bit planes (LSB plane often reveals patterns)
- Color Channel Separation: Examine Red, Green, Blue channels separately
- Histogram Equalization: Stretch contrast to reveal hidden patterns
- Edge Detection: Apply filters to highlight boundaries
🖼️ Bit Plane Slicing
┌─────────────────────────────────────────────────────────────────┐
│                    BIT PLANE SLICING                            │
├─────────────────────────────────────────────────────────────────┤
│                                                                 │
│  Pixel Value: 1 0 1 1 0 1 0 0 (Binary: 180 decimal)           │
│               │ │ │ │ │ │ │ │                                  │
│               │ │ │ │ │ │ │ └─ Bit 0 (LSB) - Least significant │
│               │ │ │ │ │ │ └─── Bit 1                           │
│               │ │ │ │ │ └───── Bit 2                           │
│               │ │ │ │ └─────── Bit 3                           │
│               │ │ │ └───────── Bit 4                           │
│               │ │ └─────────── Bit 5                           │
│               │ └───────────── Bit 6                           │
│               └─────────────── Bit 7 (MSB) - Most significant  │
│                                                                 │
│  FORENSIC USE:                                                  │
│  - LSB Plane (Bit 0): Should look random in natural images      │
│  - Patterns in LSB plane → Possible steganography              │
│  - Other planes should show image structure                     │
└─────────────────────────────────────────────────────────────────┘
17.19 Structural Steganalysis
🏗️ What is Structural Steganalysis?
Structural steganalysis examines the internal structure of file formats to detect anomalies, inconsistencies, or embedded data in non-standard locations (e.g., comment fields, metadata, appended data).
🔍 Structural Anomalies to Check
📁 File Structure Analysis
- Appended Data: Data beyond the End of File (EOF) marker
- Extra Chunks/Headers: Unknown or unusual chunks in PNG, extra segments in JPEG
- Corrupted Headers: Headers that don't match expected values
- Size Discrepancies: File size doesn't match expected size based on image dimensions
- Multiple EOF Markers: Multiple JPEG EOI markers indicating appended data
📦 Container Analysis
- Steganography in ZIP/RAR: Hidden files within archive comments
- PDF Steganography: Hidden objects, compressed streams, or metadata
- Office Documents: Hidden sheets, macros, or OLE objects
- Alternate Data Streams (ADS): NTFS hidden streams
- Slack Space: Unused space in disk clusters
🛠️ Structural Analysis Tools
| Tool | Purpose | Command Example |
|---|---|---|
| Binwalk | Find embedded files and data | binwalk suspicious.jpg |
| Hexdump / xxd | View raw file structure | xxd suspicious.jpg | head -100 |
| Strings | Extract readable text | strings suspicious.jpg |
| ExifTool | Analyze metadata structure | exiftool -v suspicious.jpg |
17.20 Steganography Tools (Steghide, OpenStego, DeepSound)
Steghide is a popular command-line steganography tool that hides data in JPEG, BMP, WAV, and AU files with optional encryption.
📌 Key Features:
- Supports JPEG, BMP, WAV, AU files
- AES-256 encryption of hidden data
- Compression of hidden data
- Password protection
- Cross-platform (Linux, Windows, Mac)
⚡ Basic Commands:
# Hide data
steghide embed -cf cover.jpg -ef secret.txt -p password123

# Extract data
steghide extract -sf stego.jpg -p password123

# Get info about file
steghide info stego.jpg

# List supported algorithms
steghide encinfo
OpenStego is a free, open-source steganography tool with a GUI interface, written in Java.
📌 Key Features:
- GUI and command-line interfaces
- Supports PNG, BMP, and other formats
- Digital watermarking support
- MD5 hash verification
- Randomized embedding (harder to detect)
⚡ Basic Commands:
# Hide data (CLI)
openstego -embed -mf secret.txt -cf cover.png -sf stego.png

# Extract data
openstego -extract -sf stego.png -xf extracted.txt
DeepSound is a Windows-based steganography tool that hides data in audio files (WAV, FLAC, APE).
📌 Key Features:
- Hide any file type in audio
- Encrypt data with AES-256
- Multi-file carrier support
- Password protection
- Audio format conversion
⚡ Usage:
- Load carrier audio file(s)
- Add secret files
- Set encryption password
- Save stego audio file
📌 Additional Steganography Tools:
- OutGuess: JPEG steganography (Linux)
- F5: JPEG steganography resistant to statistical detection
- StegHide (JPHide): Old but still used JPEG steganography
- Snow: Hides data in whitespace of text files
- Hide4PGP: Hides data in PGP-encrypted messages
- Cloakify: Converts data into list of words
- StegCracker: Steghide password cracking tool
17.21 Steganalysis Tools (StegDetect, StegExpose, StegSpy)
StegDetect is a popular steganalysis tool that detects hidden data in JPEG images using statistical methods.
📌 Detection Methods:
- Chi-square test (jsteg detection)
- OutGuess detection
- JPHide detection
- Invisible Secrets detection
- F5 detection
⚡ Basic Commands:
# Detect steganography in JPEG
stegdetect -t jopi suspicious.jpg

# Enable all tests
stegdetect -t all image.jpg

# Output results to file
stegdetect -t jopi -s results.txt image.jpg

# Verbose output
stegdetect -t jopi -v image.jpg
StegExpose is a modern steganalysis tool that runs multiple statistical tests simultaneously.
📌 Tests Performed:
- Chi-square test (Primary)
- Sample pairs analysis
- RS analysis (Regular/Singular)
- Primary Sets (SPA)
- Structural steganalysis
⚡ Basic Commands:
# Run all tests on image
python StegExpose.py image.jpg

# Run on directory
python StegExpose.py /path/to/images/

# Output JSON results
python StegExpose.py image.jpg --json
StegSpy is a signature-based steganography detection tool that identifies known steganography tools by their signatures.
📌 Detected Tools:
- JSteg, JPHide, OutGuess
- Hide & Seek, StegHide
- Invisible Secrets
- JPX, Masker
- Steg (JPEG)
⚡ Basic Usage:
# Analyze image
stegspy image.jpg

# Analyze all images in folder
stegspy /path/to/images/*.jpg📌 Additional Tools:
- Hiderman: Advanced statistical steganalysis
- Virtual Steganographic Laboratory (VSL): Modular steganalysis platform
- StegBrute: Brute-force password cracker for stego files
- StegCracker: Python-based steganalysis
- Aleph: Machine learning-based steganalysis
- StegoSuite: Commercial steganalysis software
- WetStone's StegoWatch: Enterprise steganalysis
17.22 Command Line Tools (ExifTool, Binwalk, Strings)
ExifTool is the most comprehensive metadata reader/writer, supporting hundreds of file formats.
📌 Basic Commands:
# Read all metadata
exiftool image.jpg

# Read GPS data only
exiftool -GPS* image.jpg

# Read specific tags
exiftool -Make -Model -DateTimeOriginal image.jpg

# Extract thumbnail
exiftool -b -ThumbnailImage image.jpg > thumb.jpg

# Remove all metadata
exiftool -all= image.jpg

# Export to JSON
exiftool -j image.jpg > metadata.json
🔍 Forensic Commands:
# Find files with GPS data
exiftool -GPS* -r /path/to/photos/

# Find suspicious metadata
exiftool -Comment -Copyright -Artist image.jpg

# Compare two images
exiftool -j image1.jpg image2.jpg

# Extract all metadata for analysis
exiftool -a -u -g1 image.jpg

# Verify file type
exiftool -FileType image.jpg
Binwalk analyzes binary files to find embedded files and executable code.
📌 Basic Commands:
# Scan for embedded files
binwalk suspicious.jpg

# Extract embedded files
binwalk -e suspicious.jpg

# Recursive extraction
binwalk -Me suspicious.jpg

# Show file signatures
binwalk -I suspicious.jpg
🔍 Forensic Commands:
# Deep scan with entropy analysis
binwalk -E suspicious.jpg

# Scan and generate hex dump
binwalk -W suspicious.jpg

# Compare two files
binwalk -W image1.jpg image2.jpg

# Scan all files in directory
binwalk /path/to/files/*
Strings extracts ASCII and Unicode text from binary files, revealing hidden messages or suspicious strings.
📌 Basic Commands:
# Extract ASCII strings
strings suspicious.jpg

# Extract Unicode strings
strings -e l suspicious.jpg

# Extract both ASCII and Unicode
strings -e l -n 8 suspicious.jpg

# Output to file
strings suspicious.jpg > strings.txt
🔍 Forensic Commands:
# Extract minimum 10 character strings
strings -n 10 suspicious.jpg

# Show offset positions
strings -t d suspicious.jpg

# Scan entire directory
strings /path/to/files/*.jpg

# Combine with grep for specific words
strings suspicious.jpg | grep -i "secret\|password\|http"
🛠️ Additional Command Line Tools
| Tool | Purpose | Example Command |
|---|---|---|
| Hexdump (xxd) | View raw hex bytes | xxd image.jpg | head -50 |
| File | Identify file type | file suspicious.jpg |
| Md5sum / Sha256sum | Calculate file hashes | sha256sum suspicious.jpg |
| Diff | Compare two files | diff image1.jpg image2.jpg |
| Grep | Search for patterns | strings image.jpg | grep -i "hidden" |
17.23 Digital Watermarking & Fingerprinting
🏷️ What is Digital Watermarking?
Digital watermarking is the process of embedding information into a digital signal (image, audio, video) that can be detected or extracted to verify authenticity, ownership, or integrity.
🔹 Types of Digital Watermarks
- Visible Watermarks: Logos, text (e.g., "© Getty Images") - Deters unauthorized use
- Invisible Watermarks: Embedded in LSB/DCT - Verifies ownership without visual distraction
- Robust Watermarks: Resistant to compression, cropping, scaling - For copyright protection
- Fragile Watermarks: Destroyed by any modification - For tamper detection
- Fingerprinting: Unique identifier for each copy - For tracking distribution
🔹 Applications
- Copyright Protection: Prove ownership of digital content
- Content Authentication: Detect tampering and forgery
- Broadcast Monitoring: Track when content is aired
- Digital Rights Management (DRM): Control content usage
- Forensic Tracking: Identify leaked content source
📊 Watermarking vs Steganography
| Feature | Digital Watermarking | Steganography |
|---|---|---|
| Primary Goal | Copyright protection & content authentication | Hidden / covert communication |
| Robustness | High - Must survive compression, scaling, cropping | Low - Often fragile, easily destroyed |
| Payload Capacity | Low (few bytes to KB) | High (KB to MB depending on carrier) |
| Detection | Specific reader/software required | Secret key or algorithm knowledge required |
| Visibility | Can be visible (logos) or invisible | Always invisible to human eye |
| Attack Resistance | Designed to resist removal | Not designed to resist active attacks |
17.24 Deepfakes & AI-Generated Images
🤖 What are Deepfakes?
Deepfakes are synthetic media created using artificial intelligence and deep learning that replace a person's likeness with someone else's, or generate entirely fake but realistic-looking content.
🔹 Types of Deepfakes
- Face Swapping: Replace one person's face with another's in video
- Lip Syncing: Modify mouth movements to match different audio
- Face Reenactment: Transfer facial expressions from one person to another
- Voice Cloning: Generate synthetic speech mimicking a person's voice
- Full Body Motion Transfer: Transfer body movements between individuals
- AI-Generated Images: Create realistic faces/scenes from text prompts (GANs, Diffusion Models)
🔹 Detection Methods
- Visual Artifacts: Inconsistent lighting, blurring, unnatural eye movements
- Blinking Analysis: Deepfakes often have abnormal blinking patterns
- Facial Landmark Inconsistencies: Misaligned facial features
- Temporal Inconsistencies: Frame-to-frame artifacts in video
- AI Detection Models: CNN, RNN, and transformer-based detectors
- Digital Forensic Analysis: PRNU, compression artifacts, metadata
🛠️ Deepfake Detection Tools
| Tool | Type | Description |
|---|---|---|
| Deepware Scanner | Web/App | Free deepfake detection for videos |
| Microsoft Video Authenticator | Tool | Analyzes video for manipulation |
| Sensity AI | Commercial | Enterprise deepfake detection platform |
| FakeSpot | Browser Extension | Detects fake reviews and content |
17.25 Steganography in Malware & Ransomware
🦠 How Malware Uses Steganography
Cybercriminals increasingly use steganography to hide malicious payloads, evade detection, and establish covert command-and-control (C2) communication channels.
🔹 Malware Steganography Techniques
- Payload Hiding: Malware code hidden inside images, audio, or video files
- Configuration Data: C2 server addresses, encryption keys hidden in innocent files
- Data Exfiltration: Stolen data hidden in images uploaded to social media
- Covert C2 Communication: Hidden commands in image files downloaded from legitimate sites
- Persistence: Malware hidden in Alternate Data Streams (ADS) or slack space
🔹 Known Malware Examples
- Zeus/Zbot: HID configuration data in images
- Stuxnet: Used steganography to hide code and evade detection
- Duqu: Hidden payloads in JPEG images
- Stegoloader: Malware downloaded from images on legitimate websites
- RedDoor: C2 communication via social media images
- Ursnif: Banking Trojan using image steganography
🔬 Ransomware & Steganography
Ransomware groups use steganography to:
- Hide Encryption Keys: Public keys hidden in images to avoid detection
- Conceal Payment Instructions: Bitcoin wallet addresses embedded in ransom notes
- Covert Communication: C2 servers communicating via image downloads/uploads
- Evade Network Detection: Steganographic traffic bypasses DPI and IDS/IPS
- Analyze all images for embedded data using steganalysis tools
- Monitor network traffic for suspicious image transfers
- Check for files with high entropy (randomness)
- Examine Alternate Data Streams (ADS) on NTFS systems
- Analyze memory dumps for in-memory hidden payloads
17.26 Steganography in Counter-Terrorism & Espionage
🕵️ Steganography in National Security
State actors, terrorist organizations, and intelligence agencies have long used steganography for covert communications, intelligence gathering, and operational planning.
🔹 Known Cases
- 9/11 Attacks: Reports suggest hijackers used steganography to communicate via public websites
- Russian Intelligence: Alleged use of steganography in cyber espionage campaigns
- ISIS/Terrorist Groups: Used steganography to hide propaganda and operational plans in images on social media
- WikiLeaks: Alleged steganographic communication with sources
- Chinese Cyber Espionage: Use of steganography to exfiltrate stolen data
🔹 Government Countermeasures
- Deep packet inspection (DPI) for network steganography
- Automated steganalysis of public websites and social media
- AI/ML-based detection of steganographic content
- International cooperation for tracking steganographic communications
- Entropy-based anomaly detection
📊 Modern Threat Landscape
| Threat Actor | Steganography Use | Detection Difficulty |
|---|---|---|
| Nation-State APTs | C2 communication, data exfiltration, malware delivery | Very High |
| Terrorist Organizations | Operational planning, propaganda distribution | High |
| Cybercriminals | Malware hiding, credential theft, ransomware | Medium-High |
| Insider Threats | Data exfiltration via image files | Medium |
17.27 Legal Implications of Steganography
⚖️ Legal Status by Jurisdiction
| Country | Legal Status | Relevant Laws |
|---|---|---|
| United States | Generally legal (with exceptions) | CFAA, DMCA, Export Controls |
| United Kingdom | Legal (but can be used as evidence) | Computer Misuse Act, RIPA |
| China | Heavily restricted | Cybersecurity Law, State Secrets Law |
| Russia | Restricted for classified information | State Secrets Law |
| European Union | Generally legal | GDPR (privacy implications) |
🔍 Criminal vs Legitimate Use
- Child exploitation material distribution
- Terrorism communication
- Espionage and state secrets theft
- Malware distribution (botnets, ransomware)
- Data exfiltration from secure systems
- Copyright infringement
- Digital watermarking for copyright protection
- Secure communication (journalists, whistleblowers)
- Medical records protection in telemedicine
- Secure voting systems
- Digital forensics training
- Anti-counterfeiting measures
- Explain steganography in simple terms for judge/jury
- Document the complete methodology used
- Show chain of custody for all evidence
- Demonstrate repeatable results
- Be prepared to defend the detection method
17.28 Ethical Use in Digital Forensics
🛡️ Ethical Guidelines for Forensic Investigators
Forensic investigators must balance the need to uncover evidence with ethical obligations and legal constraints.
- Obtain proper legal authorization before analysis
- Work only on forensic copies, never originals
- Document all actions and findings
- Use validated and court-accepted tools
- Maintain chain of custody
- Respect privacy rights and data protection laws
- Report findings truthfully and objectively
- Stay within scope of authorization
- Don't exceed legal authorization
- Don't work on original evidence
- Don't use unvalidated tools without verification
- Don't speculate beyond evidence
- Don't destroy or modify evidence
- Don't violate attorney-client privilege
- Don't disclose confidential information without authorization
- Don't overstate conclusions
📋 Professional Certifications & Ethics
| Certification | Ethics Code | Key Principles |
|---|---|---|
| CHFI (EC-Council) | Code of Ethics | Integrity, Confidentiality, Professionalism |
| GCFE/GCFA (SANS) | GIAC Code of Ethics | Objectivity, Competence, Integrity |
| EnCE (OpenText) | Certification Agreement | Professional conduct, Ethical behavior |
| CCFP (ISC)² | (ISC)² Code of Ethics | Protect society, Honest, Competent, Diligent |
17.29 Reporting Steganography Findings in Court
📄 Forensic Report Structure
- Executive Summary: High-level findings for non-technical readers
- Case Information: Case number, investigator, authorization, dates
- Evidence Inventory: List of examined files with hash values
- Methodology: Tools and techniques used (with version numbers)
- Findings: Detailed results with evidence references
- Statistical Analysis: Test results and significance levels
- Extracted Data: Hidden content (if extracted successfully)
- Limitations: What couldn't be determined
- Conclusion: Fact-based conclusions
- Appendices: Raw data, logs, screenshots
🎤 Expert Witness Testimony Tips
- Review your report thoroughly
- Prepare simple explanations of technical concepts
- Create visual aids (diagrams, screenshots)
- Anticipate cross-examination questions
- Review opposing expert's potential arguments
- Practice testimony with colleagues
- Stay calm and professional
- Answer only what you're asked
- Say "I don't know" when uncertain
- Stick to the evidence, not speculation
- Explain technical terms in plain language
- Don't argue with opposing counsel
📋 Sample Court-Ready Explanation
"Your Honor, steganography is like writing a secret message with invisible ink. The image you see appears normal, but hidden within the digital data is another message. Using specialized forensic tools, I was able to detect that this image contained hidden data, and after applying the correct decryption key, I extracted the following information..."
17.30 Famous Steganography Cases
Summary: Russian intelligence officers used steganography to communicate with Moscow Center.
Technique: Hidden messages within images posted on public websites.
Outcome: Ten agents arrested, swapped in prisoner exchange.
Forensic Value: Demonstrated state-sponsored use of steganography.
Summary: Sophisticated malware targeting Iranian nuclear facilities.
Technique: Steganography used to hide code within images and avoid detection.
Outcome: Damaged centrifuges, set back nuclear program.
Forensic Value: First known use of steganography in nation-state malware.
Summary: FBI investigation of Playpen dark web child exploitation site.
Technique: Network investigative technique (NIT) deployed via steganography.
Outcome: Hundreds of arrests worldwide.
Forensic Value: Legal challenges regarding NIT deployment.
Summary: Dark web marketplace takedown.
Technique: Hidden messages and keys within images on the site.
Outcome: Ross Ulbricht convicted, life sentence.
Forensic Value: Demonstrated steganography in dark web investigations.
17.31 Practical Lab Exercises
Objective: Hide and extract text using LSB steganography.
Tools: Python, OpenCV, stegano library
# Install required library
pip install stegano

# Hide message
from stegano import lsb
lsb.hide("cover.png", "Secret message").save("stego.png")

# Extract message
message = lsb.reveal("stego.png")
print(message)
Task: Hide your name in an image and extract it.
Objective: Use Steghide to hide and extract files.
Tools: Steghide (command line)
# Hide a text file in an image
steghide embed -cf cover.jpg -ef secret.txt -p password123

# Extract hidden file
steghide extract -sf stego.jpg -p password123

# Get information about a stego file
steghide info stego.jpg
Task: Hide a file and then extract it.
Objective: Extract and analyze metadata from images.
Tools: ExifTool, Metadata2Go, Pic2Map
# Extract all metadata
exiftool image.jpg

# Extract GPS coordinates
exiftool -GPS* image.jpg

# Export to JSON
exiftool -j image.jpg > metadata.json
Task: Find GPS coordinates in a photo and map them.
Objective: Detect hidden data using steganalysis tools.
Tools: StegDetect, StegExpose
# Detect hidden data in JPEG
stegdetect -t jopi suspicious.jpg

# Run multiple tests
stegdetect -t all image.jpg

# Use StegExpose
python StegExpose.py suspicious.jpg
Task: Analyze a suspected stego image for hidden content.
Objective: Hide data in audio files using DeepSound.
Tools: DeepSound (Windows), Python
# Using Python's stegano for audio
# Note: DeepSound is GUI-based

# Alternative: LSB in WAV using Python
import wave

# Read WAV file
wav = wave.open("cover.wav", 'rb')
frames = bytearray(wav.readframes(wav.getnframes()))

# Modify LSBs (simplified)
# ... hide secret bits ...

# Save modified WAV
wav.close()
Task: Hide a text file in an audio file and extract it.
Objective: Detect image tampering using forensic tools.
Tools: Forensically (web), FotoForensics
- Visit Forensically
- Upload a tampered image
- Run Error Level Analysis (ELA)
- Analyze Clone Detection results
- Examine Noise Analysis
Task: Identify edited areas in a manipulated image.
📋 Lab Submission Requirements
- Screenshots of each step
- Original and stego files (with hash values)
- Extracted hidden messages
- Analysis of detection results
- Reflection on challenges faced
- Legal/ethical considerations noted
Application Password Crackers (Forensic Perspective)
Passwords are one of the most critical pieces of digital evidence in modern investigations. From compromised applications and insider threats to malware infections and data breaches, investigators frequently encounter password hashes, credential stores, and authentication artifacts. This module explains how password cracking is approached strictly from a forensic and legal standpoint, focusing on analysis, validation, reporting, and courtroom defensibility.
Forensic password analysis aims to understand incidents, not to break into systems.
18.1 Password Storage Mechanisms & Credential Artifacts
🔐 How Applications Store Passwords
Modern applications rarely store passwords in plaintext. Instead, they rely on hashing, salting, and key derivation algorithms to protect credentials. Understanding storage mechanisms is essential for forensic interpretation.
📦 Common Password Storage Locations
- Application databases
- Configuration files
- Registry entries
- Credential managers
- Memory (volatile artifacts)
🧠 Password Representations
- Plaintext (rare, insecure systems)
- Hashed values
- Salted hashes
- Encrypted credentials
- Token-based authentication
18.2 Hashing Algorithms & Forensic Interpretation
🧮 What is a Hash?
A hash is a fixed-length representation of data produced by a mathematical function. In forensics, hashes are used to identify, compare, and validate credential artifacts.
📊 Common Password Hash Algorithms
| Algorithm | Security Level | Forensic Notes |
|---|---|---|
| MD5 | Weak | Fast, commonly cracked, legacy systems |
| SHA-1 | Weak | Deprecated, collision-prone |
| SHA-256 | Moderate | Used with salts |
| bcrypt | Strong | Slow, resistant to brute force |
| PBKDF2 | Strong | Key stretching enabled |
18.3 Password Cracking Techniques (Forensic Context)
🔍 Why Cracking is Used in Forensics
Investigators may attempt password recovery to validate breach scope, identify weak credentials, or attribute user activity. This is always performed under legal authorization.
🧪 Common Forensic Cracking Approaches
- Dictionary-based analysis
- Rule-based mutation analysis
- Password reuse detection
- Credential correlation across systems
🚫 What Forensics Does NOT Do
- Unauthorized brute-force attacks
- Online password guessing
- Live system exploitation
18.4 Memory-Based Credentials & Volatile Artifacts
🧠 Passwords in Memory
Some applications temporarily store credentials in system memory. Memory forensics can reveal authentication tokens, cached passwords, or decrypted credentials.
📌 Common Memory Credential Artifacts
- Cleartext passwords (temporary)
- Session cookies
- Authentication tokens
- Kerberos tickets
🔍 Forensic Value
- Proves active user sessions
- Supports timeline reconstruction
- Helps identify compromised accounts
18.5 Legal Boundaries, Reporting & Courtroom Relevance
⚖️ Legal Considerations
Password analysis must always comply with privacy laws, warrants, corporate policies, and scope limitations.
📄 Reporting Password Findings
- Source of credential artifacts
- Hash types identified
- Analysis methodology
- Recovered passwords (if any)
- Security impact assessment
🧠 Courtroom Perspective
- Explain hashing in simple terms
- Show repeatable methodology
- Demonstrate chain of custody
- Avoid speculative conclusions
Password forensics is about evidence interpretation, not unauthorized access.
Log Computing & Event Correlation
Logs are the digital footprints of system activity. Almost every action performed on a computer, server, application, or network device leaves traces in log files. This module explains how forensic investigators collect, analyze, correlate, and interpret logs to reconstruct incidents, detect intrusions, attribute user actions, and present timelines that stand up in court.
If data was accessed, modified, or deleted — logs usually know.
19.1 Understanding Logs & Log Sources
📜 What Are Logs?
Logs are structured or semi-structured records automatically generated by operating systems, applications, databases, and network devices to record events and actions.
🗂️ Major Log Categories
- Operating System Logs
- Application Logs
- Security & Authentication Logs
- Network & Firewall Logs
- Cloud & SaaS Logs
🖥️ Common Log Sources
| Source | Log Type | Forensic Value |
|---|---|---|
| Windows OS | Event Logs | User activity, logins, policy changes |
| Linux | Syslog | Processes, auth, services |
| Web Servers | Access/Error Logs | Web attacks, data access |
| Firewalls | Traffic Logs | Ingress/egress evidence |
| Cloud | Audit Logs | API & admin activity |
19.2 Log Integrity, Preservation & Anti-Forensics
🔐 Importance of Log Integrity
Logs are only valuable if their integrity can be proven. Attackers often attempt to delete, modify, or poison logs to hide activity.
🛡️ Preservation Best Practices
- Immediate log collection
- Write-once storage
- Hash verification
- Secure time synchronization
🧨 Log Anti-Forensics Techniques
- Log deletion or truncation
- Timestamp manipulation
- Log flooding (noise injection)
- Service restarts to clear buffers
19.3 Event Correlation & Timeline Reconstruction
🔗 What is Event Correlation?
Event correlation is the process of linking related events across multiple log sources to understand the full sequence of an incident.
🧭 Correlation Dimensions
- Time (timestamps)
- User accounts
- IP addresses
- Hostnames
- Process identifiers
📊 Example Correlation Flow
| Time | Log Source | Event |
|---|---|---|
| 10:21 | Firewall | Inbound connection allowed |
| 10:22 | Windows | Successful login |
| 10:23 | Application | Admin privilege used |
| 10:25 | Database | Bulk data export |
19.4 Log Analysis Tools & SIEM (Forensic View)
🧰 Log Analysis Tools
Investigators use both manual and automated tools to process large volumes of log data.
📌 Tool Categories
- Native OS log viewers
- Search & parsing tools
- Timeline generation tools
- SIEM platforms (post-incident analysis)
🧠 SIEM in Forensics
Security Information and Event Management (SIEM) systems aggregate logs from multiple sources and apply correlation rules.
19.5 Reporting, Attribution & Courtroom Presentation
📄 Reporting Log Findings
- Log sources & collection methods
- Time normalization & offsets
- Correlated event chains
- Supporting artifacts
- Limitations & assumptions
👤 Attribution Challenges
- Shared accounts
- NAT & proxy usage
- VPN masking
- Clock drift
Logs do not lie — but they must be interpreted carefully, correlated correctly, and explained clearly.
Network Forensics Tools (Cellebrite)
Network forensics focuses on the collection, analysis, and interpretation of network-based evidence. Unlike disk forensics, network forensics examines data in motion rather than data at rest. This module explains how investigators use Cellebrite network-capable tools to analyze communications, reconstruct activity, correlate network artifacts, and present findings that withstand legal scrutiny.
Every digital action communicates over a network — and networks remember.
20.1 Fundamentals of Network Forensics
🌐 What is Network Forensics?
Network forensics is the branch of digital forensics that deals with the monitoring, capture, and analysis of network traffic to detect intrusions, investigate incidents, and attribute malicious activity.
📡 Types of Network Evidence
- Packet captures (PCAP)
- Firewall & router logs
- IDS/IPS alerts
- DNS, DHCP & proxy logs
- Mobile & ISP communication records
🧠 Why Network Forensics Matters
- Detects lateral movement
- Identifies command-and-control traffic
- Reconstructs attack timelines
- Links devices, users, and locations
20.2 Overview of Cellebrite Network Forensic Capabilities
🧰 What is Cellebrite?
Cellebrite is a globally trusted digital intelligence platform used by law enforcement, military, and enterprises. While widely known for mobile forensics, Cellebrite also plays a critical role in network and communication analysis.
📦 Relevant Cellebrite Components
- UFED – Device data extraction
- Inspector – Artifact & communication analysis
- Analytics – Cross-data correlation
- Cloud Analyzer – Cloud-based communications
🔍 Network-Centric Use Cases
- Call & message routing analysis
- IP address & session correlation
- Cloud account access tracing
- Communication pattern reconstruction
20.3 Network Evidence Sources & Traffic Reconstruction
📥 Network Data Sources
- ISP & telecom records
- Enterprise network devices
- Mobile carrier metadata
- Cloud service access logs
- Application communication artifacts
🧭 Traffic Reconstruction
Network reconstruction involves rebuilding communication sessions to determine who communicated with whom, when, and how.
📊 Example Reconstruction Flow
| Source | Artifact | Forensic Value |
|---|---|---|
| Mobile Device | App logs | Session timestamps |
| ISP | IP records | Location attribution |
| Cloud Service | Audit logs | Account access proof |
20.4 Correlation, Attribution & Anti-Forensics
🔗 Network Event Correlation
Cellebrite enables investigators to correlate network evidence with device data, user behavior, and application artifacts.
👤 Attribution Challenges
- NAT & shared IP addresses
- VPN & anonymization services
- Carrier-grade NAT
- Dynamic IP allocation
🧨 Network Anti-Forensics
- Encrypted tunnels
- Traffic obfuscation
- Proxy chaining
- Ephemeral messaging
20.5 Reporting, Legal Considerations & Courtroom Use
📄 Network Forensic Reporting
- Evidence sources & acquisition methods
- Correlation methodology
- Timeline reconstruction
- Attribution confidence levels
- Limitations & assumptions
⚖️ Legal & Privacy Boundaries
- Lawful authority & warrants
- Data minimization principles
- Cross-border data considerations
Network forensics transforms invisible communications into legally defensible digital narratives.
Investigating Tools (Open-Source vs Commercial)
Digital forensic investigations rely heavily on specialized tools to collect, analyze, validate, and report evidence. Investigators must carefully select tools that are technically reliable, legally defensible, and fit for purpose. This module provides a deep comparison between open-source forensic tools and commercial forensic suites, explaining when, why, and how each category is used in professional investigations.
In court, investigators must defend not only evidence — but also the tools used to obtain it.
21.1 Role of Tools in Digital Forensic Investigations
🧰 Why Tools Matter
Digital forensic tools assist investigators in performing complex technical tasks in a repeatable, verifiable, and documented manner. Without proper tools, forensic analysis becomes error-prone and legally vulnerable.
🎯 Core Functions of Forensic Tools
- Evidence acquisition (disk, memory, mobile)
- Data parsing & decoding
- Artifact extraction
- Timeline reconstruction
- Correlation & reporting
21.2 Open-Source Forensic Tools
🌐 What Are Open-Source Tools?
Open-source forensic tools are publicly available and allow investigators to inspect, modify, and validate the underlying code. These tools are widely used in academia, research, and professional investigations.
📌 Advantages of Open-Source Tools
- Transparent algorithms & logic
- Community peer review
- No licensing cost
- Highly customizable
⚠️ Limitations
- Limited official support
- Steeper learning curve
- Manual validation often required
🧪 Common Use Cases
- Research & education
- Supplementary analysis
- Validation of commercial tool results
21.3 Commercial Forensic Tools
🏢 What Are Commercial Tools?
Commercial forensic tools are proprietary platforms developed by vendors to provide end-to-end forensic workflows. They are widely used by law enforcement, enterprises, and courts.
📌 Advantages of Commercial Tools
- Vendor support & training
- Standardized workflows
- Court acceptance history
- Integrated reporting
⚠️ Limitations
- High licensing costs
- Limited transparency of algorithms
- Vendor dependency
21.4 Comparative Analysis & Tool Selection Criteria
📊 Open-Source vs Commercial (Forensic View)
| Criteria | Open-Source | Commercial |
|---|---|---|
| Cost | Free | Expensive licenses |
| Transparency | High | Low (black-box) |
| Support | Community-based | Vendor-provided |
| Court Acceptance | Context-dependent | Widely accepted |
| Customization | High | Limited |
🎯 Tool Selection Factors
- Case type & jurisdiction
- Legal requirements
- Budget & resources
- Examiner expertise
- Need for validation
21.5 Reporting, Validation & Courtroom Defense
📄 Reporting Tool Usage
- Tool name & version
- Configuration & settings
- Methodology followed
- Validation steps
- Known limitations
⚖️ Courtroom Considerations
- Repeatability of results
- Peer acceptance
- Error rates
- Examiner competence
Courts trust investigators — not tools. Tools must support expert testimony, not replace it.
Investigating Network Traffic (Wireshark)
Network traffic analysis is a cornerstone of modern digital forensics. Wireshark is the most widely used network protocol analyzer for capturing and examining packets in detail. This module explains how forensic investigators use Wireshark to analyze packet captures (PCAPs), reconstruct sessions, identify malicious behavior, correlate network events, and present findings in a legally defensible manner.
Disk forensics shows what existed — network forensics shows what happened.
22.1 Fundamentals of Network Traffic & Packet Analysis
📦 What is Network Traffic?
Network traffic consists of data packets exchanged between devices over a network. Each packet contains headers and payloads that reveal communication behavior.
📡 Key Packet Components
- Source & destination IP addresses
- Source & destination ports
- Protocols (TCP, UDP, ICMP, etc.)
- Timestamps
- Payload data (when unencrypted)
🧠 Forensic Value of Packets
- Identify communicating hosts
- Detect scanning & exploitation
- Reconstruct sessions
- Prove data exfiltration
22.2 Wireshark Overview & Capture Methodology
🧰 What is Wireshark?
Wireshark is an open-source packet analyzer used to capture, decode, and inspect network traffic at a very granular level.
📥 Packet Capture Sources
- Live network interfaces
- Saved PCAP files
- SPAN / mirror ports
- Network taps
- Cloud traffic exports
⚖️ Legal Considerations
- Authorization before capture
- Privacy & data minimization
- Scope definition
22.3 Protocol Analysis & Traffic Filtering
🔍 Protocol Dissection
Wireshark automatically decodes hundreds of protocols, allowing investigators to analyze communication behavior at each OSI layer.
📌 Common Protocols Examined
- HTTP / HTTPS
- DNS
- SMTP / POP / IMAP
- FTP / SMB
- ICMP
🧭 Filtering Concepts
- Capture filters (pre-capture)
- Display filters (post-capture)
- Protocol-based filters
- IP, port & time-based filters
22.4 Session Reconstruction & Attack Detection
🔗 Session Reconstruction
Session reconstruction allows investigators to follow complete conversations between hosts, revealing intent and actions.
🧪 Indicators of Malicious Traffic
- Port scanning patterns
- Repeated failed connections
- Unusual DNS requests
- Suspicious file transfers
- Command-and-control traffic
📊 Example Forensic Flow
| Evidence | Observation | Inference |
|---|---|---|
| DNS logs | Random domain queries | Possible malware beaconing |
| TCP sessions | Large outbound transfers | Data exfiltration |
22.5 Correlation, Reporting & Courtroom Use
🔗 Correlating Network Traffic
- Match packets with system logs
- Link IPs to user accounts
- Correlate with firewall & IDS alerts
- Align with timeline analysis
📄 Reporting Wireshark Findings
- PCAP source & hash values
- Capture methodology
- Relevant packet streams
- Decoded protocol evidence
- Limitations (encryption, missing packets)
⚖️ Courtroom Explanation
- Explain packets in simple language
- Use visual stream diagrams
- Avoid speculative conclusions
Wireshark turns raw packets into a clear, evidence-backed narrative of network activity.
Investigating Wireless Attacks
Wireless networks extend connectivity beyond physical boundaries, making them attractive targets for attackers. This module explains how forensic investigators analyze wireless attacks by examining radio communications, access point logs, client artifacts, and network traffic. The focus is on evidence identification, correlation, attribution, and legal defensibility.
Wireless attacks often leave evidence on multiple devices — not just the attacker.
23.1 Wireless Networking Fundamentals (Forensics View)
📡 What is Wireless Communication?
Wireless communication uses radio frequencies (RF) to transmit data between devices without physical cables. In investigations, RF-based attacks require analysis beyond traditional network logs.
📶 Common Wireless Technologies
- Wi-Fi (IEEE 802.11)
- Bluetooth & BLE
- RFID / NFC
- Cellular (indirect wireless evidence)
🧠 Forensic Challenges
- Limited capture window
- Transient attacker presence
- Shared airspace
- Encrypted communications
23.2 Types of Wireless Attacks & Indicators
🚨 Common Wireless Attack Categories
- Unauthorized access (rogue clients)
- Rogue access points
- Evil twin attacks
- Deauthentication attacks
- Man-in-the-Middle (MITM)
- Bluetooth-based attacks
🔍 Indicators of Wireless Attacks
- Repeated disconnections
- Multiple failed authentication attempts
- Unknown BSSIDs or SSIDs
- Signal strength anomalies
- Unexpected encryption downgrades
23.3 Wireless Evidence Sources & Data Collection
📥 Key Evidence Sources
- Wireless access points (AP logs)
- Wireless LAN controllers
- Client device logs
- Authentication servers (RADIUS)
- RF captures (monitor mode)
🧭 Evidence Types
- Association & authentication logs
- MAC address mappings
- Signal strength records
- Channel usage data
23.4 Traffic Analysis, Correlation & Attribution
🔗 Wireless Traffic Analysis
Wireless traffic analysis involves examining management frames, control frames, and data frames to reconstruct events.
🧠 Correlation Techniques
- Align RF captures with AP logs
- Match MAC addresses to devices
- Correlate timestamps across systems
- Link wireless events to wired traffic
👤 Attribution Challenges
- MAC address spoofing
- Shared devices
- Physical proximity ambiguity
- Public wireless environments
23.5 Reporting, Legal Boundaries & Courtroom Presentation
📄 Reporting Wireless Forensic Findings
- Network architecture description
- Wireless standards & configurations
- Evidence sources & collection methods
- Correlated timelines
- Confidence levels & limitations
⚖️ Legal Considerations
- Authorization for RF monitoring
- Privacy & interception laws
- Public vs private wireless spaces
Wireless forensics turns invisible radio activity into structured, defensible digital evidence.
Investigating Web Application Attacks
Web applications are among the most frequently targeted systems due to their public exposure and direct access to sensitive data. This module explains how forensic investigators analyze web application attacks by examining server logs, application logs, databases, traffic captures, and user activity. Emphasis is placed on attack reconstruction, evidence correlation, root cause analysis, and legal defensibility.
Most web attacks leave traces across multiple layers — browser, web server, application logic, and database.
24.1 Web Application Architecture (Forensic Perspective)
🌐 Understanding Web Application Layers
To investigate a web attack, an examiner must understand how a web application processes requests. Each layer may contain valuable evidence.
🏗️ Common Web Architecture Layers
- Client (Browser / Mobile App)
- Web Server (Apache, Nginx, IIS)
- Application Layer (PHP, Java, Python, Node.js)
- Database (MySQL, PostgreSQL, MSSQL)
- Authentication & Authorization Services
🧠 Why Architecture Matters
- Helps identify where evidence is stored
- Explains how attacker input flows
- Supports root cause analysis
24.2 Common Web Application Attacks & Indicators
🚨 Major Categories of Web Attacks
- SQL Injection (SQLi)
- Cross-Site Scripting (XSS)
- Authentication bypass
- File inclusion (LFI / RFI)
- Command injection
- Session hijacking
- Business logic abuse
🔍 Indicators of Web Attacks
- Unusual URL parameters
- Repeated failed login attempts
- Unexpected HTTP status codes
- Sudden privilege escalation
- Abnormal database queries
24.3 Web Logs & Application Log Analysis
📜 Primary Evidence Sources
- Web server access logs
- Web server error logs
- Application-specific logs
- Authentication logs
- Database query logs
📊 Key Log Fields to Analyze
- IP address
- Timestamp
- HTTP method (GET, POST, PUT)
- Requested URL
- User-Agent
- Response code
24.4 Attack Reconstruction & Timeline Analysis
🧭 What is Attack Reconstruction?
Attack reconstruction is the process of rebuilding the attacker’s actions step-by-step using collected evidence.
🔗 Correlation Techniques
- Align access logs with application events
- Map database changes to HTTP requests
- Link user sessions to authentication records
- Compare attacker IPs across systems
🕒 Timeline Construction
- Initial access
- Exploration attempts
- Exploitation phase
- Data access or modification
- Persistence or cleanup
24.5 Attribution, Reporting & Legal Considerations
👤 Attribution Challenges
- Proxy and VPN usage
- Shared hosting environments
- Compromised intermediary systems
- False flag indicators
📄 Reporting Web Application Attacks
- Application overview
- Attack vectors identified
- Evidence sources & integrity
- Reconstructed timeline
- Impact assessment
- Remediation recommendations
⚖️ Legal & Compliance Aspects
- Data protection regulations
- Log retention policies
- Chain of custody
- Court-admissible documentation
Web application forensics transforms raw logs into legally defensible evidence narratives.
Tracking & Investigating: Log Analysis & Email Crime Forensics
Digital forensics and investigation are critical skills for modern cybersecurity professionals. In this comprehensive guide from NotesTime.in, you'll master the art of tracking digital evidence through log analysis and email crime investigation. Learn how to analyze system logs, investigate email headers, trace sender IP addresses, detect phishing attempts, and understand email authentication mechanisms like SPF, DKIM, and DMARC. These forensic investigation techniques are essential for incident response, cyber crime investigation, and building robust security monitoring systems. Perfect for cybersecurity beginners, IT professionals, and forensic analysts preparing for certifications.
25.1 🔐 Attacks via Logs
Logs are the digital footprints of every action that happens on a system, network, or application. They record events like user logins, file changes, network connections, and system errors. However, attackers can also manipulate, forge, or exploit logs to hide their tracks or execute attacks.
Logs help investigators answer critical questions: Who accessed the system? When did it happen? What changes were made? Without logs, detecting attacks becomes nearly impossible.
1️⃣ Types of Attacks Targeting Logs
-
📝 Log Injection:
Attackers insert malicious data into log files by exploiting unsanitized user input. For example, adding fake log entries to mislead investigators or trigger false alerts.
Example: InjectingUser logged in as admininto logs to create false evidence. -
✏️ Log Forging (Falsification):
Creating fake log entries or modifying existing ones to hide malicious activity or frame innocent users.
Example: Changing timestamps to make an attack appear as normal activity. -
☠️ Log Poisoning:
Corrupting log files to disrupt logging systems or evade detection. Attackers may add special characters or malformed data to break log parsers.
Example: InsertingNULLbytes or SQL queries into logs. -
🗑️ Log Deletion:
Deleting log files or clearing specific entries to remove evidence of unauthorized access.
Example: Runningrm -rf /var/log/*on a compromised server. -
🔄 Log Rotation Exploitation:
Attackers trigger log rotation to archive old logs and make real-time monitoring harder.
Example: Generating massive traffic to rotate logs and overwrite evidence.
2️⃣ Log-Based Reconnaissance
Attackers can also read logs to gather sensitive information:
- 🔍 Finding passwords accidentally logged in error messages
- 📊 Understanding system architecture from debug logs
- 🎯 Identifying user behavior patterns for social engineering
- 🗺️ Discovering internal IP addresses and network structure
In 2019, a major cloud provider experienced a log injection attack where attackers added fake entries to suggest that a security breach was a false alarm, delaying the incident response by several hours.
3️⃣ How to Protect Logs
- 🛡️ Centralized Logging (SIEM): Send logs to a secure, centralized server.
- 🔐 Log Integrity Protection: Use cryptographic signing to detect tampering.
- 📝 Input Sanitization: Prevent log injection by sanitizing user inputs.
- 🚫 Access Control: Restrict who can read, write, or delete logs.
- ⏱️ Immutable Storage: Use write-once, read-many (WORM) storage for critical logs.
25.2 📧 Email Crime Investigation
Email is one of the most common vectors for cyber attacks, including phishing, spoofing, harassment, fraud, and business email compromise (BEC). Investigating email crimes requires understanding email architecture, analyzing headers, tracing origins, and gathering digital evidence.
According to the FBI, Business Email Compromise (BEC) attacks have caused over $50 billion in losses worldwide.
1️⃣ Email Architecture & Protocols
Understanding how email works is essential for investigation:
| Protocol | Port | Purpose |
|---|---|---|
| SMTP (Simple Mail Transfer Protocol) | 25, 587, 465 | Sends emails between servers |
| POP3 (Post Office Protocol 3) | 110, 995 | Downloads emails from server (deletes after download) |
| IMAP (Internet Message Access Protocol) | 143, 993 | Syncs emails across multiple devices (keeps on server) |
2️⃣ Common Email Crimes
- 🎣 Phishing: Fake emails pretending to be legitimate companies to steal credentials or install malware.
- 🔄 Email Spoofing: Forging the "From" address to make an email appear from someone else.
- 💼 Business Email Compromise (BEC): Impersonating executives or vendors to trick employees into sending money.
- 😡 Email Harassment: Sending threatening, abusive, or unwanted emails repeatedly.
- 💰 Email Fraud: Using emails for lottery scams, inheritance scams, or advance-fee fraud.
Email investigation follows a systematic process: Collection → Preservation → Analysis → Reporting
25.3 🎯 Attribution Techniques
Attribution is the process of identifying the person, group, or system responsible for a cyber attack or crime. In email investigations, attribution involves tracing emails back to their true origin — not just the displayed sender.
1️⃣ Key Attribution Methods
-
🌐 IP Address Tracing:
Extracting the originating IP from email headers (e.g.,Received,X-Originating-IP) and geolocating it.
⚠️ Limitation: Attackers may use VPNs, proxies, or compromised servers. -
📧 Email Header Analysis:
ExaminingReceivedchains to trace the email's path through mail servers.
💡 Tip: The firstReceivedentry usually shows the origin. -
🔑 Authentication Checks (SPF, DKIM, DMARC):
Validating whether the email passed or failed authentication — failures indicate spoofing. -
🕵️ OSINT (Open Source Intelligence):
Searching for the email address, domain, or sender name on social media, breach databases, and public records. -
📱 Device Fingerprinting:
Analyzing email metadata like User-Agent, Mailer, and X-Mailer to identify the software or device used.
2️⃣ Challenges in Attribution
- Attackers use anonymizing tools (VPN, Tor, ProtonMail)
- Compromised legitimate accounts are hard to distinguish from attackers
- Cross-border legal issues make tracing difficult
- False flags (attackers framing others) complicate investigations
3️⃣ Attribution in Practice
An executive receives a suspicious email requesting a wire transfer. The investigator:
1️⃣ Extracts the
Received chain from headers2️⃣ Identifies the originating IP address
3️⃣ Checks SPF/DKIM alignment — finds a mismatch (spoofing confirmed)
4️⃣ Traces the IP to a known VPN exit node
5️⃣ Concludes it's a targeted BEC attack from an anonymous source
25.4 🔍 Email Header Analysis (Step-by-Step)
Email headers contain metadata about the message — who sent it, when, which servers it passed through, and more. Learning to read headers is a fundamental forensic skill.
1️⃣ How to View Email Headers
- Gmail: Open email → Click three dots → "Show original"
- Outlook: Open email → File → Properties → Internet headers section
- Yahoo Mail: Open email → More → View raw message
- Apple Mail: View → Message → Raw Source
- Thunderbird: View → Headers → All
2️⃣ Key Header Fields to Analyze
| Field | What It Shows | Forensic Value |
|---|---|---|
From: |
Displayed sender address | Can be spoofed — don't trust alone! |
Return-Path: |
Where bounces go | Often reveals real sending address |
Reply-To: |
Where replies are sent | Attackers use this to redirect responses |
Received: |
Mail server hop-by-hop path | Most important for tracing origin |
Received-SPF: |
SPF check result | Pass = domain authorized, Fail = spoofed |
DKIM-Signature: |
Digital signature | Validates email wasn't altered |
Message-ID: |
Unique identifier | Useful for tracking across systems |
Date: |
When email was sent | Timezone info may indicate location |
X-Originating-IP: |
Sender's IP (if recorded) | Direct clue to attacker's location |
Authentication-Results: |
SPF/DKIM/DMARC results | Quick legitimacy check |
Received entry is usually the first hop (closest to the sender).
25.5 📡 Tracing Sender IP & Relay Servers
Tracing an email back to its source requires analyzing the Received headers, which record every mail server the email passed through.
1️⃣ How to Trace Step-by-Step
-
Extract all Received headers: Each
Received:line shows one mail server hop. - Read from bottom to top: The bottom-most entry is the first hop (closest to sender).
-
Look for the originating IP: The first hop often contains the sender's IP address in format like
[192.168.1.1]. - Check for X-Originating-IP: Some servers add this field with the original sender's IP.
-
Geolocate the IP: Use tools like
whoisor IP geolocation databases.
2️⃣ Example Header Analysis
Received: from mail.example.com (mail.example.com [203.0.113.5]) by mx.google.com with ESMTP
Received: from user-pc (192.168.1.100) by mail.example.com with ESMTPS
Received: from [10.0.0.5] (unknown [203.0.113.10]) by relay.attacker.com with ESMTP
Analysis (bottom to top):
- First hop: IP
203.0.113.10→ Attacker's real IP or proxy - Second hop: Through
mail.example.com(intermediate server) - Third hop: Received by Google's mail server → Delivered to victim
- Attackers can use open relays, VPNs, or compromised servers to hide real IPs.
- Email services like ProtonMail don't log sender IPs.
- Some Received headers may be forged (though difficult to do correctly).
25.6 🎭 Identifying Spoofed Email Addresses
Email spoofing is when attackers forge the From: address to make an email appear from someone else.
Here's how to detect spoofing.
1️⃣ Signs of Spoofing
-
❌ SPF Failure: The
Received-SPF: failheader indicates the sending server isn't authorized. - ❌ DKIM Failure: Missing or invalid DKIM signature means the email wasn't signed by the claimed domain.
-
🔄 Mismatched From/Return-Path: Different domains in
From:andReturn-Path:suggest spoofing. - 🌐 Unusual Received Chain: The email path doesn't match the claimed domain's infrastructure.
2️⃣ Spoofing vs Legitimate Email Comparison
| Indicator | Legitimate Email | Spoofed Email |
|---|---|---|
| SPF Result | ✔ Pass | ✘ Fail / None |
| DKIM Signature | ✔ Valid | ✘ Missing / Invalid |
| DMARC Alignment | ✔ Aligned | ✘ Not aligned |
| From vs Return-Path | Same domain | Different domains |
| Received Chain | Matches domain's mail servers | Unusual or unrelated servers |
25.7 🎣 Phishing Email Detection Techniques
Phishing emails are designed to trick users into clicking malicious links, downloading malware, or revealing credentials. Here's how to spot them.
1️⃣ Red Flags to Watch For
- 🚨 Urgent or threatening language: "Your account will be closed immediately!"
- 🔗 Suspicious links: Hover over links — do they match the claimed domain?
- 📎 Unexpected attachments: Especially .exe, .zip, .js, .docm files.
- ❌ Spelling and grammar errors: Professional companies rarely send error-ridden emails.
- 🆔 Generic greetings: "Dear Customer" instead of your name.
- 🎁 Too good to be true offers: "You won a lottery you never entered!"
- 📧 Mismatched sender domain: amazon-support@fake-domain.com
2️⃣ Technical Detection Methods
- ✅ Check SPF, DKIM, DMARC results in headers
- ✅ Analyze link destinations without clicking (hover or use link scanners)
- ✅ Verify the domain age (new domains are suspicious)
- ✅ Check if the domain has HTTPS (not a guarantee but good practice)
- ✅ Use online sandboxes to safely open suspicious attachments
- VirusTotal — Scan links and attachments
- urlscan.io — Safe link analysis
- Talos Intelligence — Domain reputation check
25.8 📜 SPF (Sender Policy Framework) Explained
SPF (Sender Policy Framework) is an email authentication method that specifies which mail servers are authorized to send emails for a domain. It helps prevent email spoofing.
How SPF Works
- Domain owner publishes an SPF record in DNS (TXT record).
- Receiving server checks if the sending server's IP is listed in the SPF record.
- Result:
Pass(authorized),Fail(not authorized), orNone(no SPF record).
v=spf1 include:_spf.google.com ~allThis means: Allow Google's mail servers, and mark others as soft fail.
-
+all = Allow all (dangerous!)-
-all = Fail if not matched (strict)-
~all = Soft fail (mark as suspicious)-
?all = Neutral
25.9 🔗 SPF Alignment & Authentication
SPF Alignment ensures that the domain in the From: header matches the domain that passed SPF.
This is required for DMARC compliance.
SPF Alignment Modes
- Strict Alignment (smtp.mailfrom=header.from): Domains must match exactly.
- Relaxed Alignment (smtp.mailfrom=*.example.com): Subdomains allowed.
25.10 🔏 DKIM (DomainKeys Identified Mail)
DKIM adds a digital signature to emails using public-key cryptography. It ensures that the email wasn't altered in transit and that it came from the claimed domain.
How DKIM Works
- Sending server signs the email with a private key.
- DKIM signature is added to the email headers.
- Receiving server looks up the public key in DNS and verifies the signature.
- Result:
Pass(signature valid) orFail(tampered or invalid).
DKIM-Signature: v=1; a=rsa-sha256; d=example.com; s=selector1; bh=...; b=...
-
d= Domain that signed the email-
s= Selector (points to DNS record)-
bh= Body hash-
b= Digital signature
25.11 ✅ DKIM Signature Validation & Authentication
Validating a DKIM signature confirms two things:
- Integrity: The email wasn't modified after signing.
- Authenticity: The email came from the claimed domain.
How to Validate DKIM
- Extract the
DKIM-Signatureheader. - Look up the public key using
selector._domainkey.example.comDNS TXT record. - Use online DKIM validators or command-line tools like
opendkim-testmsg.
Authentication-Results: mx.google.com; dkim=pass header.i=@example.com
25.12 🛡️ DMARC Policy & Enforcement
DMARC (Domain-based Message Authentication, Reporting & Conformance) builds on SPF and DKIM. It tells receiving servers what to do when emails fail authentication.
DMARC Policy Levels
| Policy | Action |
|---|---|
p=none |
Monitor only — no action (reporting mode) |
p=quarantine |
Mark suspicious emails as spam |
p=reject |
Block the email entirely |
v=DMARC1; p=reject; rua=mailto:reports@example.com; ruf=mailto:forensics@example.com
-
rua (Aggregate reports): Summary of authentication results-
ruf (Forensic reports): Detailed failure data
25.13 🛠️ Email Tracing Using MXToolbox & Google Admin Toolbox
Several free online tools help investigators analyze email headers, check domain reputation, and trace origins.
Recommended Tools
-
🌐 MXToolbox: mxtoolbox.com
- Email header analyzer
- SPF/DKIM/DMARC lookup
- Blacklist checking -
🔧 Google Admin Toolbox: toolbox.googleapps.com
- Message header analyzer
- Check MX, SPF, DKIM, DMARC - 📧 Email Header Analyzer (DKIMvalidator): dkimvalidator.com
- 🕵️ IPinfo.io: ipinfo.io — IP geolocation and WHOIS
1️⃣ Copy full email headers → 2️⃣ Paste into MXToolbox header analyzer → 3️⃣ Review SPF/DKIM/DMARC results → 4️⃣ Trace IP addresses
25.14 🔍 Verifying Domain & Mail Server Records (MX, SPF, DKIM)
Before trusting an email, verify the domain's DNS records:
Commands to Verify Records
dig example.com MX — Check mail serversdig example.com TXT — View SPF and DKIM recordsnslookup -type=TXT example.com — Windows alternative
What to Check
- MX Records: Should point to legitimate mail servers (Google, Microsoft, or company servers).
- SPF Record: Should exist and include authorized sending IPs.
- DKIM Record: Should exist at
selector._domainkey.example.com. - DMARC Record: Should exist at
_dmarc.example.com.
25.15 ✅ Checking Email Legitimacy Using Online Tools
Use these free tools to verify if an email or domain is legitimate:
Domain & Email Reputation Checkers
-
📊 Talos Intelligence: talosintelligence.com
Check domain reputation and email volume. -
🔗 VirusTotal: virustotal.com
Scan suspicious links and attachments with 70+ antivirus engines. -
🛡️ URLScan.io: urlscan.io
Safely analyze suspicious URLs without clicking. -
📧 EmailRep.io: emailrep.io
Check if an email address is associated with suspicious activity.
25.16 📧 Analyzing Suspicious Emails in Gmail (Show Original Feature)
Gmail's "Show Original" feature provides complete email headers and authentication results. Here's how to use it.
Step-by-Step Guide
- Open the suspicious email in Gmail.
- Click the three dots (⋮) in the top-right corner.
- Select "Show original".
- Review the authentication results at the top:
SPF: PASS with IP 209.85.220.41DKIM: PASS with domain example.comDMARC: PASS
What to Look For
- ✅ All green (PASS) → Email is likely legitimate
- ⚠️ Any red (FAIL) → Email may be spoofed or tampered
- 🔍 Grey (SOFTFAIL/NEUTRAL) → Authentication not configured properly
25.17 🎭 Email Spoofing vs Legitimate Email Comparison
Here's a side-by-side comparison of spoofed vs legitimate emails to help you spot the difference.
| Feature | Legitimate Email | Spoofed Email |
|---|---|---|
| Sender Domain | Matches company's real domain | Similar but different (e.g., amaz0n.com) |
| SPF Result | PASS | FAIL / SOFTFAIL |
| DKIM Result | PASS | FAIL / Missing |
| DMARC Result | PASS | FAIL |
| Grammar/Spelling | Professional | Errors or awkward phrasing |
| Links | Match company's real domain | Redirect to suspicious domains |
| Greeting | Personalized (Dear John) | Generic (Dear Customer) |
| Urgency | 三道AppropriateExtreme urgency or threats |
25.18 💼 Business Email Compromise (BEC) Investigation
Business Email Compromise (BEC) is a sophisticated scam targeting companies that make wire transfers or have suppliers. Attackers impersonate executives or vendors to trick employees into sending money.
Common BEC Scenarios
- 👔 CEO Fraud: Fake email from CEO requesting urgent wire transfer.
- 🏢 Vendor Impersonation: Fake invoice from a legitimate vendor with changed bank details.
- 👥 Account Compromise: Employee's email is hacked and used to request payments.
- ⚖️ Attorney Impersonation: Fake legal requests for sensitive data or payments.
BEC Investigation Steps
- Preserve evidence: Capture full email headers, download attachments, take screenshots.
- Analyze headers: Check SPF/DKIM/DMARC — failures indicate spoofing.
- Trace IP addresses: Identify the true origin of the email.
- Check domain age: Attackers often use recently registered domains.
- Review email logs: Identify if any employee accounts were compromised.
- Contact financial institutions: Attempt to freeze or reverse fraudulent transfers.
- Report to authorities: File complaint with IC3 (ic3.gov).
25.19 🕵️ Tracing Anonymous / Temporary Email Services
Attackers often use temporary or anonymous email services (disposable emails) to hide their identity. Here's how investigators trace them.
Common Anonymous Email Services
- 📧 ProtonMail (Swiss-based, no IP logging)
- 📧 Guerrilla Mail (temporary, self-destructing)
- 📧 10 Minute Mail (disposable)
- 📧 Mailinator (public inbox, no registration)
- 📧 Tutanota (encrypted, German-based)
Investigation Techniques
- 📋 Legal Requests: Send subpoenas to email providers for account information.
- 🕐 Timing Analysis: Correlate email timestamps with other evidence (surveillance, logs).
- 🔗 Linking Evidence: The same anonymous email may be used across multiple platforms.
- 🌐 IP Address (if available): Some services log IPs (check headers carefully).
- 📱 Device Fingerprinting: Browser/device info in email headers may link to other activities.
25.20 📋 Case Study: Phishing Attack Investigation
Let's walk through a real-world phishing investigation example.
Scenario
Investigation Steps
- Preserve the phishing email: Extract full headers and save as .eml file.
- Analyze email headers:
- SPF: FAIL — not authorized
- DKIM: Missing
- Return-Path: Different domain than claimed
- Trace the link:
- Link redirected through URL shortener → finally to
fake-login.example.com - Domain registered 3 days ago (red flag)
- Link redirected through URL shortener → finally to
- Trace IP:
- Extracted originating IP from headers:
185.xxx.xxx.xxx - Geolocation: Netherlands (company is in US — suspicious)
- IP associated with known VPN provider
- Extracted originating IP from headers:
- Review logs:
- Employee logged in from the phishing site at 2:15 PM
- Suspicious login from attacker IP at 4:30 PM
- Containment:
- Reset compromised credentials
- Block phishing domain on firewall
- Enable MFA for all employees
Findings & Recommendations
- ✅ Phishing domain added to threat intelligence feeds
- ✅ Employee received security awareness training
- ✅ SPF/DKIM/DMARC implemented for company domain
- ✅ Email filtering rules updated to block similar patterns
🎓 Module 25 : Tracking & Investigating Successfully Completed
You have successfully completed this module of Cyber Forensics Investigation.
Keep building your expertise step by step — Learn Next Module →
Detailed Investigative Report – Court-Ready Digital Forensics
A forensic investigation is only as strong as its final report. This module focuses on creating legally admissible, technically accurate, and professionally structured forensic reports. The report is the primary document presented to management, regulators, law enforcement, and courts. This module teaches how to transform technical findings into a clear, defensible evidence narrative.
Investigations fail in court not due to lack of evidence, but due to poor reporting.
26.1 Purpose & Legal Importance of Forensic Reports
⚖️ Why the Report Matters
A forensic report is the official record of an investigation. It must explain what happened, how it happened, when it happened, who was involved, and how conclusions were reached.
📌 Who Uses the Report?
- Judges and courts
- Law enforcement agencies
- Corporate legal teams
- Auditors and regulators
- Executive leadership
🧠 Legal Expectations
- Objectivity and neutrality
- Repeatable methodology
- Clear chain of custody
- Evidence integrity
26.2 Structure of a Court-Ready Forensic Report
📄 Standard Report Sections
| Section | Description |
|---|---|
| Executive Summary | High-level overview for non-technical readers |
| Scope & Authorization | Legal permission and investigation boundaries |
| Evidence Inventory | List of collected digital items |
| Methodology | Step-by-step forensic process |
| Findings | Technical results with evidence references |
| Timeline | Chronological reconstruction of events |
| Conclusion | Fact-based conclusions |
| Appendices | Hashes, logs, screenshots, raw data |
26.3 Evidence Documentation & Chain of Custody
🧾 Evidence Documentation
Every piece of evidence must be clearly documented from the moment it is identified.
📦 Evidence Records Must Include
- Evidence description
- Source system
- Date and time of acquisition
- Collector’s identity
- Hash values
🔗 Chain of Custody
- Who collected the evidence
- Who handled it
- When and where it was stored
- Any transfers or access
26.4 Writing Findings, Conclusions & Expert Opinions
🧠 Writing Forensic Findings
- State only what evidence proves
- Avoid assumptions and speculation
- Reference evidence clearly
- Use neutral language
📌 Difference Between Facts & Opinions
| Facts | Opinions |
|---|---|
| Supported by evidence | Based on expertise |
| Repeatable | Explain reasoning |
| Objective | Clearly labeled |
⚖️ Expert Testimony Preparation
- Understand your own report fully
- Be ready to explain technical terms simply
- Defend methodology, not opinions
26.5 Compliance, Ethics & Professional Standards
📜 Standards & Frameworks
- ISO/IEC 27037 (Digital Evidence Handling)
- NIST Digital Forensics Guidelines
- ACPO principles
🛡️ Ethical Responsibilities
- Maintain neutrality
- Protect sensitive data
- Disclose limitations
- Avoid conflicts of interest
🎯 Final Investigator Checklist
- Authorization verified
- Evidence integrity confirmed
- Timeline validated
- Findings peer-reviewed
- Report legally defensible
A court-ready forensic report is not just technical — it is structured, ethical, repeatable, and legally sound.
Legal Framework & Cyber Laws
Cyber laws are the legal frameworks that govern digital activities, cybercrimes, electronic commerce, and data protection. This module provides a comprehensive understanding of the Information Technology Act, 2000 (IT Act), cyber crime categories, legal procedures, evidence admissibility, and the role of forensic investigators in the legal system.
Understanding cyber laws is essential for forensic investigators to ensure evidence is collected legally and remains admissible in court.
27.1 Introduction to Cyber Law
⚖️ What is Cyber Law?
Cyber Law (also known as Internet Law or Digital Law) is the area of law that deals with the internet, cyberspace, computers, and digital devices. It governs legal issues related to:
- Cyber crimes and digital offenses
- Electronic commerce and digital signatures
- Data protection and privacy
- Intellectual property in digital space
- Digital evidence and forensic procedures
🎯 Need for Cyber Laws
- To regulate digital activities and transactions
- To protect individuals and organizations from cyber crimes
- To provide legal recognition to electronic documents and signatures
- To establish punishment for cyber offenders
- To facilitate e-commerce and digital governance
- USA: Computer Fraud and Abuse Act (CFAA), ECPA, GDPR compliance
- India: Information Technology Act, 2000 (IT Act)
- EU: General Data Protection Regulation (GDPR)
- UK: Computer Misuse Act 1990
- Australia: Cybercrime Act 2001
27.2 What is Computer Forensics?
🔍 Definition of Computer Forensics
Computer Forensics is a branch of digital forensic science pertaining to evidence found in computers and digital storage media. The goal of computer forensics is to examine digital media in a forensically sound manner with the aim of identifying, maintaining, recovering, analyzing, and presenting facts and opinions about the digital information.
📌 Key Aspects of Computer Forensics
Identify
Recognizing potential digital evidence sourcesMaintain
Preserving evidence integrityRecover
Extracting data from storage mediaAnalyze
Interpreting digital evidencePresent
Presenting facts and opinions in court27.3 Objectives of Computer Forensics
Track and Prosecute Perpetrators
To track and prosecute perpetrators (Apradhi) of a cyber crime by gathering admissible evidence.
Gather Evidence Forensically
To gather evidence of cyber crimes in a forensically sound manner that maintains integrity.
Estimate Potential Impact
To estimate the potential impact of a malicious activity on the victim organization.
Minimize Losses
To minimize the tangible and intangible losses to the organization.
Protect from Future Incidents
To protect the organization from similar incidents in the future by identifying vulnerabilities and recommending security improvements.
27.4 What is Cyber Crime?
⚠️ Definition of Cyber Crime
Cyber Crime is defined as any illegal act involving a computing device, network, its systems, or its applications.
OR
Any type of hacking performed using the internet or electronic devices...
🔍 Key Characteristics of Cyber Crime
Uses Computing Device
Computer, mobile, tablet, etc.Uses Network
Internet, intranet, or private networkTargets Systems
Computers, servers, databasesUses Applications
Software, apps, services27.5 Cyber Crime Categories & Types
1. Computer Fraud
Unauthorized access, manipulation, or destruction of computer data for personal gain.
2. Privacy Violation
Exposing personal or confidential data over the internet without consent.
3. Identity Theft
Stealing personal information from systems/networks to impersonate someone.
4. Sharing Copyrighted Files
Leaking confidential files or sharing copyrighted content illegally.
5. Electronic Money Transfer Fraud
Unauthorized net banking transactions and payment frauds.
6. Electronic Money Laundering
Converting black money to white through digital transactions.
7. ATM Fraud
Cloning of ATM cards to withdraw money illegally.
8. DOS Attack
Denial of Service Attack targeting routers or servers to disrupt services.
9. MITM Attack
Man in the Middle Attack - Capturing packets between transmission channels.
10. Spam
Fake mailing system for phishing and malware distribution.
27.6 Internal vs External Attacks
Cyber crimes can be categorized into two types based on the line of attack:
Definition: Breach of trust by disgruntled or unsatisfied employees within the organization.
📌 Examples:
- Spying (Jasoosi): Corporate espionage by employees
- Theft of Intellectual Property: Stealing trade secrets, source code, patents
- Manipulation of Records: Altering financial or customer data
- Trojan Horse Attack: Installing backdoors from inside
Definition: Attackers hired either by internal or external entities to destroy the organization's reputation.
📌 Examples:
- SQL Attack: SQL Injection to extract database information
- Brute Force: Password guessing attacks
- Identity Theft: Stealing and misusing credentials
- Phishing/Spoofing: Fake emails and websites to trick users
- Denial of Service Attack: Overwhelming servers with traffic
- Cyber Defamation (Badnaamee): Damaging reputation online
27.7 Cyber Terrorism
💣 What is Cyber Terrorism?
Cyber terrorism means to damage information, computer systems, and data that result in harm against non-combatant targets.
Cyberterrorism is the use of the Internet to conduct violent acts that result in, or threaten, loss of life or significant bodily harm, in order to achieve political or ideological gains through threat or intimidation.
📡 Communication Channels Used by Terrorists
- Email conversation - Encrypted communications
- Telephonic conversation - VoIP and encrypted calls
- Gaming platform - Hidden communication through multiplayer games
🇮🇳 Case Study: 26/11 Mumbai Attacks
The 26/11 Mumbai attacks highlighted the need for cyber surveillance. Following this, NATGrid (National Intelligence Grid) was formed to integrate and analyze intelligence data from various sources.
27.8 Cyber Bullying & Online Harassment
😔 What is Cyber Bullying?
Cyber bullying is the use of electronic communication to bully, harass, or intimidate a person, typically by sending messages of an intimidating or threatening nature.
⚠️ Types of Cyber Bullying
- Harassment - Repeatedly sending offensive messages
- Impersonation - Pretending to be someone else online
- Outing - Sharing private information publicly
- Cyberstalking - Monitoring someone's online activity
- Fraping - Logging into someone's account to post inappropriate content
⚖️ Legal Protection
Under Section 66A of the IT Act (before it was struck down) and other relevant sections, cyber bullying is punishable. Victims can also file complaints under the Indian Penal Code for:
- Section 354D - Stalking
- Section 507 - Criminal intimidation by anonymous communication
- Section 509 - Word, gesture or act intended to insult modesty of a woman
27.9 Types of Information & Protection
📊 Data vs Information
Data
Raw Facts
Example: "25", "John", "01/01/1990"Information
Processed data or collection of data
Example: "John Doe, age 25, born on 01/01/1990"🔐 Types of Information
Confidential Information
Aadhar Cards, Passwords, Birth Certificates, PAN CardsFinancial Information
Financial Statements, Bank Details, Banking CredentialsHealth Information
Policies, Diseases information, Medical RecordsPersonal Information
Address, Phone Numbers, Date of Birth- Use strong encryption for sensitive data
- Implement access controls and authentication
- Regular security audits and monitoring
- Employee training on data handling
- Comply with data protection regulations (GDPR, IT Act, etc.)
27.10 Computer Forensics Process & Artifacts
📋 The Complete Forensic Process
Legal Document
AuthorizationList Artifacts
Evidence InventoryImaging
Bit-by-bit CopyPreserve
Air-tight ContainerAnalysis
With PaperworkDocument
Real EvidenceConclusion
Court Submission📦 What are Artifacts?
Artifacts are pieces of digital evidence that are collected during a forensic investigation. They include:
- Legal document authorizing the investigation
- List of artifacts collected
- Bit-by-bit forensic images
- Original artifacts in sealed containers
- Analysis documentation with proper paperwork
- Documented real evidence from artifacts
- Final conclusion for court submission
27.11 Information Technology Act, 2000 (IT Act Sections 43-74)
🇮🇳 Overview of IT Act, 2000
The Information Technology Act, 2000 (ITA-2000) is the primary law in India dealing with cybercrime and electronic commerce. It was notified on 17 October 2000 and has been amended in 2008 to address emerging cyber threats.
📜 Objectives of IT Act, 2000
- To provide legal recognition for transactions carried out by means of electronic data interchange
- To facilitate electronic filing of documents with government agencies
- To amend the Indian Penal Code, Indian Evidence Act, and Bankers' Books Evidence Act
- To define cyber crimes and prescribe punishments
- To establish the Cyber Appellate Tribunal
⚖️ Key Sections of IT Act, 2000 with Punishments
| Section | Offense Description | Punishment |
|---|---|---|
| Section 43 | Damage to computer, computer system, or computer network | Imprisonment up to 2 years OR/AND fine up to ₹1,00,000 |
| Section 65 | Tampering with computer source documents | Imprisonment up to 3 years OR/AND fine up to ₹2,00,000 |
| Section 66 | Hacking with computer system | Imprisonment up to 3 years OR/AND fine up to ₹5,00,000 |
| Section 66A | Sending offensive messages through communication service | Imprisonment up to 3 years OR/AND fine up to ₹1,00,000 |
| Section 66B | Receiving stolen computer or communication device | Imprisonment up to 3 years OR/AND fine up to ₹1,00,000 |
| Section 66C | Identity Theft / Using password of another person | Imprisonment up to 3 years OR/AND fine up to ₹1,00,000 |
| Section 66D | Cheating using computer resource (Phreakers) | Imprisonment up to 3 years OR/AND fine up to ₹1,00,000 |
| Section 66E | Violation of Privacy / Publishing private images of others | Imprisonment up to 3 years OR/AND fine up to ₹2,00,000 |
| Section 66F | Acts of cyberterrorism | Imprisonment up to life / Sentence to death |
| Section 67 | Publishing information which is obscene in electronic form | Imprisonment up to 5 years OR/AND fine up to ₹10,00,000 |
| Section 67A | Publishing images containing sexual acts | Imprisonment up to 7 years OR/AND fine up to ₹10,00,000 |
| Section 67B | Publishing child porn or predating children online | First conviction: 5 years + ₹10,00,000 fine Second conviction: 7 years + ₹10,00,000 fine |
| Section 67C | Failure to maintain records | Imprisonment up to 3 years OR/AND fine |
| Section 68 | Failure/refusal to comply with orders | Imprisonment up to 2 years OR/AND fine up to ₹1,00,000 |
| Section 69 | Failure/refusal to decrypt data | Imprisonment up to 7 years and possible fine |
| Section 70 | Securing access to a protected system | Imprisonment up to 10 years OR/AND fine |
| Section 71 | Misrepresentation | Imprisonment up to 2 years OR/AND fine up to ₹1,00,000 |
| Section 72 | Breach of confidentiality and privacy | Imprisonment up to 2 years OR/AND fine up to ₹1,00,000 |
| Section 72A | Disclosure of information in breach of lawful contract | Imprisonment up to 3 years OR/AND fine up to ₹5,00,000 |
| Section 73 | Publishing false electronic signature certificate (Signature Forgery) | Imprisonment up to 2 years OR/AND fine up to ₹1,00,000 |
| Section 74 | Publication for fraudulent purpose | Imprisonment up to 2 years OR/AND fine up to ₹1,00,000 |
27.12 Evidence Admissibility Standards (Daubert, Frye)
⚖️ Daubert Standard
The Daubert Standard is a rule of evidence regarding the admissibility of expert witness testimony. Under this standard, the judge acts as a gatekeeper and considers:
- Whether the methodology has been tested
- Whether it has been peer-reviewed
- The known or potential error rate
- Whether it is generally accepted in the scientific community
⚖️ Frye Standard
The Frye Standard (older standard) requires that scientific evidence must be "generally accepted" in the relevant scientific community to be admissible.
- Frye: General acceptance only
- Daubert: General acceptance + testing + peer review + error rate
27.13 International Cooperation & Privacy Laws
🌐 International Cooperation
- MLAT (Mutual Legal Assistance Treaty): Agreements between countries for cross-border evidence sharing
- INTERPOL: International police cooperation for cybercrime investigations
- Budapest Convention: First international treaty on cybercrime
🔒 Major Privacy Laws
| Regulation | Jurisdiction | Key Requirement |
|---|---|---|
| GDPR (General Data Protection Regulation) | European Union | Data protection, breach notification within 72 hours |
| HIPAA (Health Insurance Portability and Accountability Act) | United States | Protection of health information |
| PCI-DSS (Payment Card Industry Data Security Standard) | Global | Security standards for credit card data |
| IT Act, 2000 | India | Cyber crimes, e-commerce, data protection |
Cyber laws form the legal backbone of digital forensics. Investigators must understand these laws to:
- Ensure evidence is collected legally
- Maintain chain of custody for court admissibility
- Protect themselves from legal liability
- Support prosecution of cyber criminals
Mobile Device Forensics
Mobile Device Forensics is a specialized branch of digital forensics focused on the acquisition, analysis, and reporting of evidence from mobile devices such as smartphones, tablets, and wearables. Mobile devices contain a wealth of personal and behavioral data—contacts, messages, photos, location history, app data, and cloud synchronization—making them critical evidence sources in modern investigations.
Mobile devices often contain more probative evidence than computers due to constant usage and cloud synchronization.
28.1 iOS Forensics – iPhone, iPad, iPod Touch
🍎 iOS Forensics Overview
iOS devices (iPhone, iPad, iPod Touch) are known for their strong security architecture, including hardware-based encryption, secure boot chain, and sandboxed applications. Forensic examiners must understand iOS security features to effectively extract and analyze evidence.
🔐 iOS Security Architecture (Forensic Implications)
1. Hardware Encryption
iOS devices use a dedicated AES-256 hardware engine with a device-specific UID (Unique ID) burned into the Secure Enclave. Data is encrypted with a combination of the UID and user passcode.
2. Secure Enclave
A coprocessor that handles cryptographic operations, including passcode verification and biometric authentication (Face ID/Touch ID).
3. Code Signing
Apple only allows Apple-signed code to run on iOS devices. Jailbreaking bypasses this restriction.
4. Sandboxing
Each app runs in its own sandbox, unable to access data from other apps without explicit permissions.
📥 iOS Acquisition Methods
| Method | Description | Data Retrieved | Requirements |
|---|---|---|---|
| iTunes Backup (Logical) | Extracts data from encrypted/unencrypted iTunes backups | Contacts, messages, photos, call logs, app data, notes, calendars | Computer with iTunes, device passcode (if encrypted backup) |
| iCloud Backup (Cloud) | Downloads backup from Apple's iCloud servers | Same as iTunes backup + iCloud-specific data | Apple ID credentials, legal authorization (warrant/subpoena) | File System Extraction | Accesses device's raw file system | All user data, application databases, system logs, keychain (partial) | Jailbreak or Checkm8-based bootloader exploit (iOS 12-16) |
| Physical Extraction | Chip-off or JTAG (hardware-based) | Complete memory image including deleted data | Advanced forensic lab, specialized equipment |
💻 iTunes Backup Forensics
iTunes backups are stored locally on computers when an iOS device is synced. These backups contain a wealth of forensic data.
📂 iTunes Backup Locations
# Windows 10/11
C:\Users\[Username]\AppData\Roaming\Apple Computer\MobileSync\Backup\

# macOS
~/Library/Application Support/MobileSync/Backup/

# Backup folder naming convention
[Device UDID] (40-character hexadecimal string)
📋 What iTunes Backups Contain
Communications
- SMS/MMS messages
- iMessage conversations
- Call history (incoming/outgoing/missed)
- Voicemail recordings
Contacts & Calendar
- Address book contacts
- Calendar events and invitations
- Reminders and notes
- Email account configurations
Media
- Camera Roll photos/videos
- Screenshots
- Saved images from messages
- Voice memos
App Data
- WhatsApp, Telegram, Signal chats
- Browser history (Safari)
- Location history
- Health data
Network & Device
- Wi-Fi networks and passwords
- Bluetooth pairings
- Installed apps list
- Device serial number, IMEI, UDID
Location Data
- Significant Locations (frequent visited places)
- Maps search history
- Route history
🔐 Encrypted vs Unencrypted Backups
| Feature | Unencrypted Backup | Encrypted Backup |
|---|---|---|
| Password required | No | Yes (set in iTunes/Finder) |
| Safari passwords | Not included | Included | Wi-Fi passwords | Not included | Included |
| Keychain data | Not included | Included |
| Health data | Not included | Included |
| Recommended for forensics | No (limited value) | Yes (more complete data) |
🔓 iOS Locked Device Access
A hardware-based bootrom exploit affecting A5-A11 chips (iPhone 4s to iPhone X). Allows:
- File system extraction (with proper tools)
- Brute-force passcode attacks (limited attempts)
- Compatible devices: iPhone 4s through iPhone X
- Tools: checkra1n, palera1n
Commercial forensic tools for locked device access:
- GrayKey: Brute-force passcode (limited attempts per iOS version)
- Cellebrite UFED: Physical extraction (varies by iOS version)
- Magnet AXIOM: Cloud extraction and backup analysis
🛠️ iOS Forensic Tools
| Tool | Purpose | Platform |
|---|---|---|
| Cellebrite UFED | Physical/logical extraction, locked device access | Commercial (hardware + software) |
| Magnet AXIOM | Backup analysis, cloud extraction, artifact decoding | Commercial (Windows) |
| Oxygen Forensic Detective | Backup extraction, app parsing, social graph | Commercial (Windows) |
| iBackup Viewer | Free iTunes backup viewer | Windows/macOS |
| libimobiledevice | Open-source iOS communication library | Cross-platform (CLI) |
28.2 Android Forensics – ADB, Recovery Mode, Extraction
🤖 Android Forensics Overview
Android devices present unique forensic challenges due to manufacturer fragmentation, custom ROMs, and varying security implementations. Understanding ADB, recovery mode, and extraction methods is essential for Android forensic examinations.
🔐 Android Security Architecture (Forensic Implications)
1. Full Disk Encryption (FDE) / File-Based Encryption (FBE)
Android uses encryption to protect user data. FDE encrypts the entire userdata partition; FBE allows per-file encryption with different keys.
2. Verified Boot
Cryptographically verifies the integrity of the operating system at each boot stage.
3. SELinux
Mandatory access control system that restricts app and system processes.
4. Hardware-backed Keystore
Secure storage for cryptographic keys using Trusted Execution Environment (TEE) or Secure Element.
📥 Android Acquisition Methods
| Method | Description | Data Retrieved | Requirements |
|---|---|---|---|
| Manual Extraction | Visual inspection and photographing device screen | Visible data on screen (limited) | Device accessible, proper documentation |
| ADB Logical Extraction | Backup via Android Debug Bridge | App data, contacts, messages, media (varies by Android version) | USB debugging enabled, device unlocked |
| Full File System (Rooted) | 许多人Access to entire file system via root privilegesAll user data, app databases, system logs, deleted data (if recoverable) | Root access (may require exploit or OEM unlocking) | |
| Physical Extraction | Chip-off, JTAG, ISP (hardware-based) | Complete memory image including deleted data | Advanced forensic lab, specialized equipment |
| Cloud Extraction | Google Account data (Drive, Photos, Contacts) | Google Drive files, Photos, Contacts, Calendar, Location History | Google Account credentials, legal authorization |
🖥️ ADB (Android Debug Bridge) Forensics
ADB is a versatile command-line tool that allows communication with Android devices. It is part of the Android SDK Platform Tools.
📥 ADB Installation
# Download Android SDK Platform Tools
https://developer.android.com/studio/releases/platform-tools

# Windows: Extract to C:\adb\
# Linux/macOS: Extract to /usr/local/bin/ or add to PATH

# Verify ADB installation
adb version
🔌 Enabling USB Debugging
- Go to Settings → About Phone
- Tap Build Number 7 times to enable Developer Options
- Go to Settings → Developer Options
- Enable USB Debugging
- Connect device to computer and accept RSA key fingerprint
⌨️ Essential ADB Forensic Commands
# List connected devices
adb devices

# Create full device backup
adb backup -apk -shared -all -f device_backup.ab

# Create backup of specific package
adb backup -f app_backup.ab com.whatsapp

# Pull file from device
adb pull /sdcard/Download/suspect_file.txt

# Pull entire directory
adb pull /sdcard/DCIM/ ./DCIM_backup/

# List installed packages
adb shell pm list packages

# Get device information
adb shell getprop | grep -E "ro.product|ro.build"

# Extract dumpsys (system service information)
adb shell dumpsys > dumpsys.txt
adb shell dumpsys battery > battery_info.txt
adb shell dumpsys wifi > wifi_info.txt

# Take screenshot
adb exec-out screencap -p > screenshot.png

# Record screen (requires Android 4.4+)
adb shell screenrecord /sdcard/screenrecord.mp4

# Pull logcat (system logs)
adb logcat -d > logcat.txt

# Pull dmesg (kernel logs)
adb shell dmesg > dmesg.txt

# Reboot to recovery mode
adb reboot recovery

# Reboot to bootloader
adb reboot bootloader
📊 ADB Backup Analysis
ADB backups (.ab files) are compressed archives that can be extracted and analyzed.
# Convert AB backup to TAR (using Android Backup Extractor)
java -jar abe.jar unpack device_backup.ab device_backup.tar

# Extract TAR file
tar -xvf device_backup.tar -C extracted_backup/

# Alternative: Use dd to strip header
dd if=device_backup.ab of=device_backup.tar bs=1 skip=24

# View extracted files
ls -la extracted_backup/apps/
🔄 Android Recovery Mode Forensics
Recovery mode allows investigators to access the device when the main OS is inaccessible or locked.
Accessing Recovery Mode (Common Methods)
| Device Manufacturer | Key Combination (Power off) |
|---|---|
| Samsung | Volume Up + Home + Power (older) / Volume Up + Power (newer) |
| Google Pixel | Volume Down + Power (select Recovery with volume keys) |
| OnePlus | Volume Down + Power |
| LG | Volume Down + Power, release Power when logo appears |
| Xiaomi | Volume Up + Power |
| Motorola | Volume Down + Power |
🔧 Recovery Mode Forensic Options
- ADB Access: Some custom recoveries (TWRP) enable ADB in recovery mode
- File System Mounting: Mount /data partition for file access
- Factory Reset: Can be used for testing (destroys user data)
- Sideload: Install forensic tools via ADB sideload
🔓 Android Locked Device Access
Enables bootloader unlocking (required for custom recovery installation).
- Must be enabled in Developer Options
- Wipes all user data when unlocked
- Forensic use limited to early acquisition
- Cellebrite UFED: Physical extraction for many Android devices
- Magnet AXIOM: Logical and cloud extraction
- Oxygen Forensic Detective: ADB-based extraction and app decoding
- XRY: Physical and logical extraction
🛠️ Android Forensic Tools
| Tool | Purpose | Platform |
|---|---|---|
| Cellebrite UFED | Physical/logical extraction, locked device access | Commercial (hardware + software) |
| Magnet AXIOM | Logical extraction, cloud acquisition, artifact decoding | Commercial (Windows) |
| Oxygen Forensic Detective | ADB extraction, app parsing, social graph | Commercial (Windows) |
| Autopsy | Android image analysis (with plugins) | Open source (Windows/Linux/macOS) |
| SANSA (Android forensics framework) | App data extraction and analysis | Open source (Python) |
| Android Forensics (afc) | Command-line extraction tool | Open source (Python) |
28.3 Mobile Acquisition Methods – Complete Guide
📱 Understanding Mobile Acquisition
Mobile acquisition is the process of extracting digital evidence from mobile devices. The choice of acquisition method depends on device type, OS version, security settings, and investigation requirements.
📊 Acquisition Method Comparison
| Method | Data Retrieved | Deleted Data? | Difficulty | Time | Court Acceptance |
|---|---|---|---|---|---|
| Manual | Visible screen data | No | Very Low | 5-30 min | Limited |
| Logical (Backup) | User data, app data, settings | No (generally) | Low | 10-60 min | Yes (if documented) |
| ADB (Android) | File system, app data | Limited | Medium | 15-90 min | Yes (if documented) |
| File System | Full file system | Limited (depends on storage) | High (requires exploit/root) | 30-120 min | Yes |
| Physical | Complete memory image | Yes (carving possible) | Very High | 2-8 hours | Yes (with validation) |
| Cloud | Cloud backups, synced data | Limited | Medium (legal) | 15-60 min | Yes (with warrant) |
📋 Detailed Method Descriptions
1️⃣ Manual Extraction
The simplest method—investigators photograph or document what is visible on the device screen. Used when no other acquisition is possible (e.g., locked device without exploits).
- Photograph each screen systematically
- Document the device state (battery level, signal, time)
- Use a high-resolution camera with consistent lighting
- Include timestamps in photographs
2️⃣ Logical Extraction
Extracts user-accessible data through backup protocols (iTunes, ADB, or manufacturer tools). Does not capture deleted data.
iOS Logical (iTunes)
- Requires device passcode (for encrypted backup)
- Extracts messages, contacts, photos, app data
- Tools: iTunes, iBackup Viewer, Magnet AXIOM
Android Logical (ADB)
- Requires USB debugging enabled
- Extracts app data via backup command
- Tools: ADB, Oxygen, Magnet AXIOM
3️⃣ File System Extraction
Grants access to the device's raw file system, including application databases, logs, and system files. Requires root or bootloader exploit.
- When logical extraction misses app data
- When investigating specific application artifacts
- When root access is available (jailbroken iOS, rooted Android)
4️⃣ Physical Extraction
The most comprehensive method—creates a bit-for-bit image of the device's memory chip. Can recover deleted data through carving.
Chip-off
Removing the memory chip from the circuit board and reading it with a programmer.
JTAG / ISP
Connecting to test points on the circuit board to read memory directly.
5️⃣ Cloud Extraction
Retrieves data from cloud backups and synchronized services (iCloud, Google Drive, Samsung Cloud).
- Search warrant or court order (for criminal investigations)
- Consent (for corporate investigations)
- Subpoena (for civil litigation)
🔧 Acquisition Workflow – Best Practices
Isolate
Faraday bagDocument
Photograph, notesAssess
Locked? OS version?Select Method
Logical/Physical/CloudAcquire
Forensic extractionVerify
Hash, report28.4 App Data Extraction – Messaging, Social Media, & More
📱 Understanding App Data Forensics
Mobile applications store a wealth of evidence—chat messages, media files, location data, and user preferences. Forensic examiners must understand where app data resides and how to extract it.
🗂️ Common App Data Locations
| Platform | Location | Contents |
|---|---|---|
| iOS (Backup) | Manifest.db, AppDomain-* folders |
SQLite databases, plist files, media attachments |
| iOS (File System) | /private/var/mobile/Containers/Data/Application/ |
App sandbox directories, SQLite databases, logs |
| Android (File System) | /data/data/[package_name]/ |
SQLite databases, shared preferences, cache files |
| Android (External Storage) | /sdcard/Android/data/[package_name]/ |
Media files, downloads, cache |
📨 Popular Messaging Apps – Forensic Artifacts
- Database:
msgstore.db(SQLite) - Attachments:
/Media/WhatsApp/ - Key Artifacts: Messages (including deleted), contacts, media, call logs, status updates
- Forensic Note: Encrypted backups require root/jailbreak or backup password
- Database:
signal.db(SQLite, encrypted) - Key Artifacts: Messages, contacts, attachments
- Forensic Note: Strong encryption; data extraction requires file system access
- Database:
tgdata.db(SQLite) - Key Artifacts: Messages, contacts, media, secret chats (limited)
- Forensic Note: Secret chats are end-to-end encrypted and may not be recoverable
- Database:
fb.db/threads_db2(SQLite) - Key Artifacts: Messages, attachments, reactions, call logs
- Forensic Note: Requires file system access; cloud backups may contain data
- Database:
EnMicroMsg.db(encrypted SQLite) - Key Artifacts: Messages, contacts, moments, payments
- Forensic Note: Database encryption requires IMEI/UID for decryption
- Database:
snapchat.db(SQLite) - Key Artifacts: Snap history, friends, chat messages
- Forensic Note: Media files may be ephemeral; file system extraction required
🔧 SQLite Database Forensics
Most mobile apps store data in SQLite databases. Forensic examiners can query these databases to extract evidence.
Essential SQLite Commands for Forensics
# Open SQLite database
sqlite3 msgstore.db

# View all tables
.tables

# View table schema
.schema table_name

# Query messages
SELECT * FROM messages WHERE datetime(timestamp, 'unixepoch') > '2024-01-01';

# Query deleted messages (if recoverable)
SELECT * FROM sqlite_sequence;

# Export query results to CSV
.headers on
.mode csv
.output messages.csv
SELECT * FROM messages;

# Recover deleted records (requires special tools)
# Tools: SQLite Forensic Toolkit, SQLite Recovery, Undark
🛠️ App Data Extraction Tools
| Tool | Purpose | Supported Apps |
|---|---|---|
| Cellebrite UFED | Physical/logical extraction, app decoding | 1000+ apps (WhatsApp, Signal, Telegram, WeChat, etc.) |
| Magnet AXIOM | App data extraction, artifact categorization | 500+ apps with detailed parsing |
| Oxygen Forensic Detective | App data extraction, social graph | 120+ app parsers |
| Belkasoft Evidence Center | Mobile and computer forensics | Wide app support, SQLite recovery |
🔍 Deleted Data Recovery from Apps
SQLite WAL Files
Write-Ahead Log files contain recent database changes, including deletions.Free Pages
SQLite databases mark deleted rows as "free" but data remains until overwritten.Journal Files
Rollback journals may contain pre-deletion data.28.5 Cloud Backups and Synchronization Evidence
☁️ Cloud Forensics Overview
Cloud backups and synchronization services store valuable evidence that may not be present on the physical device. Investigators can obtain data directly from cloud providers with proper legal authorization.
📦 Major Cloud Services & Forensic Value
| Service | Data Available | Acquisition Method | Legal Requirements |
|---|---|---|---|
| iCloud | Backups, photos, contacts, calendar, notes, location, keychain | Apple Legal Portal, Magnet AXIOM, Cellebrite Cloud | Search warrant / court order |
| Google (Android/Drive) | Device backups, Drive files, Photos, Contacts, Calendar, Location History, Gmail | Google Vault, Takeout, Magnet AXIOM, Cellebrite Cloud | Search warrant / court order |
| Samsung Cloud | Backups, contacts, messages, photos, notes | Samsung Legal Portal, forensic tools | Search warrant / court order |
| Microsoft OneDrive | Files, photos, Office documents | Microsoft Legal Portal, forensic tools | Search warrant / court order |
| Dropbox | Files, sharing metadata, version history | Dropbox Legal Portal, forensic tools | Search warrant / court order |
🔐 iCloud Forensics Deep Dive
iCloud backups contain most of the same data as iTunes backups, plus cloud-specific artifacts.
📋 iCloud Backup Contents
- Device backups (automatic when device is plugged in, locked, and on Wi-Fi)
- Photos (iCloud Photos Library)
- Contacts, calendars, notes, reminders
- Messages (iMessage and SMS)
- Health data (if enabled)
- Keychain (passwords, credit card info - encrypted with device passcode)
- Location data (Significant Locations)
- App data (for apps that support iCloud backup)
📥 iCloud Acquisition Methods
- Submit legal request (search warrant, court order)
- Apple provides iCloud data in a structured format
- Data includes backups, account information, device logs
- Obtain Apple ID credentials (via consent or legal process)
- Use Magnet AXIOM or Cellebrite Cloud to acquire iCloud data
- Extract and parse backups, photos, contacts, etc.
- If the device is seized, push notification may appear on the device
- Approving 2FA from seized device allows cloud acquisition
- Document all actions for chain of custody
📱 Google Account (Android) Forensics
Google accounts sync a wide range of data that can be valuable in investigations.
📋 Google Account Data Types
- Android device backups
- Google Drive files
- Google Photos
- Gmail messages
- Contacts
- Calendar events
- Chrome browsing history
- Location History (Timeline)
- YouTube history
- Google Play app installs
- Google Pay transactions
- Fit data
📥 Google Data Acquisition Methods
- Log into Google Account
- Request data export via takeout.google.com
- Select data types to include
- Download ZIP archives
- Available for Google Workspace accounts
- Retain, hold, search, and export user data
- Includes email, Drive, Chat, and Meet
- Submit legal request (search warrant, court order)
- Google provides account data through Legal Portal
- Includes account information, device logs, content
⚖️ Legal Considerations for Cloud Forensics
- Search Warrant: Required for content of communications (messages, emails, photos) in criminal investigations
- Court Order / Subpoena: May be sufficient for non-content data (account info, login logs, metadata)
- Consent: Valid for corporate investigations or when suspect voluntarily provides credentials
- Stored Communications Act (SCA): Governs access to electronic communications stored by service providers
- MLAT (Mutual Legal Assistance Treaty): Required when data is stored in another country
🛠️ Cloud Forensic Tools
| Tool | Cloud Services Supported | Features |
|---|---|---|
| Magnet AXIOM Cloud | iCloud, Google, Microsoft 365, Dropbox, Box | Automated acquisition, artifact parsing, timeline generation |
| Cellebrite Cloud | iCloud, Google, Samsung, Huawei | Mobile cloud extraction, backup analysis |
| Oxygen Forensic Cloud Extractor | iCloud, Google, Samsung, Huawei, Microsoft | Cloud acquisition and analysis | Elcomsoft Cloud Explorer | iCloud, Google, Microsoft, Facebook, Dropbox | Credential-based cloud acquisition |
📊 Cloud Acquisition Workflow
Obtain Legal
AuthorizationIdentify
Cloud AccountsSelect
Acquisition MethodAcquire
Cloud DataAnalyze
And ReportPreserve
Chain of CustodyCloud Forensics
Cloud Forensics is the application of digital forensics principles and practices to cloud computing environments. It involves the identification, collection, preservation, analysis, and presentation of evidence from cloud-based infrastructure, platforms, and applications. Unlike traditional forensics, cloud forensics faces unique challenges due to data distribution, multi-tenancy, jurisdictional boundaries, and reliance on cloud service providers.
In cloud forensics, the investigator rarely has physical access to the evidence storage hardware — evidence must be obtained through APIs, logs, and provider cooperation.
29.1 Cloud Computing Models (IaaS, PaaS, SaaS)
☁️ Understanding Cloud Service Models
Cloud computing is typically categorized into three primary service models: Infrastructure as a Service (IaaS), Platform as a Service (PaaS), and Software as a Service (SaaS). Each model presents different forensic opportunities and challenges.
📊 Cloud Service Models Comparison
| Aspect | IaaS | PaaS | SaaS |
|---|---|---|---|
| Definition | Virtualized computing resources (servers, storage, networking) | Platform for application development (OS, middleware, runtime) | Software applications delivered over the internet |
| User Control | Highest – user manages OS, apps, data | Medium – user manages apps and data only | Low – user manages only data and configuration | Forensic Access | High – direct access to VMs, volumes, logs | Medium – API-based logs, app data | Low – limited to user-accessible exports |
| Evidence Sources | VM snapshots, disk volumes, network logs, API logs | Application logs, database logs, API calls | User activity logs, file exports, metadata |
| Examples | AWS EC2, Azure VMs, Google Compute Engine | AWS Elastic Beanstalk, Azure App Service, Google App Engine | Office 365, Gmail, Salesforce, Dropbox |
🔬 Forensic Implications by Model
🏢 IaaS (Infrastructure as a Service) Forensics
Advantages
- Direct access to virtual machine images and disk volumes
- Ability to create forensic snapshots
- Network traffic logs (VPC Flow Logs, CloudTrail)
- Similar to traditional server forensics
Challenges
- Requires provider cooperation for physical access
- Multi-tenant environment complicates evidence isolation
- Volatile data may be lost during snapshot creation
- Data may be distributed across multiple availability zones
📱 PaaS (Platform as a Service) Forensics
Advantages
- API access to application logs and metrics
- Built-in auditing features
- Database snapshots and backups
Challenges
- Limited access to underlying infrastructure
- No direct disk-level forensics
- Log retention policies may limit historical data
📧 SaaS (Software as a Service) Forensics
Advantages
- User activity logs and audit trails
- Data export capabilities (Google Takeout, Microsoft Purview)
- Built-in compliance and eDiscovery features
Challenges
- Minimal forensic visibility
- Data may be stored across multiple data centers
- Reliance on provider for evidence preservation
📊 Cloud Deployment Models & Forensic Impact
| Deployment Model | Description | Forensic Access | Investigator Control |
|---|---|---|---|
| Public Cloud | Services shared across multiple organizations | Limited – provider-dependent | Low – governed by provider policies |
| Private Cloud | Dedicated infrastructure for single organization | High – direct access to hardware | High – full organizational control |
| Hybrid Cloud | Combination of public and private clouds | Variable – depends on component | Variable – mixed control |
| Community Cloud | Shared among organizations with common concerns | Moderate – shared governance | Moderate – governed by community agreement |
29.2 Evidence Collection from AWS, Azure, GCP
☁️ Major Cloud Provider Forensics
Amazon Web Services (AWS), Microsoft Azure, and Google Cloud Platform (GCP) dominate the cloud market. Each provides specific tools and APIs for forensic evidence collection.
🔷 Amazon Web Services (AWS) Forensics
📋 AWS Evidence Sources
| Service | Evidence Type | Retention | Acquisition Method |
|---|---|---|---|
| CloudTrail | API call history, user activity, resource changes | Up to 90 days (default), longer with trail | Console, CLI, API, Athena |
| VPC Flow Logs | Network traffic metadata (IP, port, protocol) | Configurable (days to years) | Console, CLI, CloudWatch Logs, S3 |
| CloudWatch Logs | Application and system logs | Configurable (default indefinite) | Console, CLI, API, Logs Insights |
| S3 Access Logs | Object access history | Configurable | S3, Athena |
| EC2 Snapshots | VM disk images (EBS volumes) | Manual or automated | Console, CLI, API, AWS Backup |
| GuardDuty Findings | Security threat detections | 90 days (findings), 365 days (archived) | Console, CLI, API, EventBridge |
🛠️ AWS Forensic Tools & Commands
# Install AWS CLI
pip install awscli
aws configure

# Capture CloudTrail events for specific time range
aws cloudtrail lookup-events \
    --start-time "2024-01-01T00:00:00Z" \
    --end-time "2024-01-15T23:59:59Z" \
    --output json > cloudtrail_events.json

# Export CloudTrail to S3 for analysis
aws cloudtrail create-trail \
    --name forensic-trail \
    --s3-bucket-name forensic-bucket \
    --is-multi-region-trail

# Query CloudTrail with Athena
aws athena start-query-execution \
    --query-string "SELECT * FROM cloudtrail_logs WHERE eventTime > '2024-01-01'" \
    --query-execution-context Database=cloudtrail_db \
    --result-configuration OutputLocation=s3://results-bucket/

# Capture VPC Flow Logs
aws ec2 describe-flow-logs \
    --filter "Name=log-group-name,Values=forensic-vpc-logs" \
    --output json > flow_logs.json

# Create EBS snapshot for forensic analysis
aws ec2 create-snapshot \
    --volume-id vol-1234567890abcdef0 \
    --description "Forensic snapshot for case INV-2024-001"

# Export EBS snapshot to S3 for offline analysis
aws ec2 export-snapshot \
    --snapshot-id snap-1234567890abcdef0 \
    --s3-bucket forensic-bucket \
    --s3-prefix snapshots/

# List GuardDuty findings
aws guardduty list-findings \
    --detector-id detector-id \
    --finding-criteria '{"Criterion":{"severity":{"Eq":[7]}}}' \
    --output json > high_severity_findings.json

# Capture EC2 instance metadata
aws ec2 describe-instances \
    --instance-ids i-1234567890abcdef0 \
    --output json > instance_metadata.json

# Capture IAM user activity
aws iam get-user --user-name suspect-user > user_details.json
aws iam list-access-keys --user-name suspect-user > access_keys.json
🔵 Microsoft Azure Forensics
📋 Azure Evidence Sources
| Service | Evidence Type | Retention | Acquisition Method |
|---|---|---|---|
| Activity Logs | Control plane operations, resource changes | 90 days (default) | Portal, CLI, PowerShell, Log Analytics |
| Resource Logs | Data plane operations (VM, storage, network) | Configurable (days to years) | Diagnostic settings, Log Analytics |
| Azure AD Sign-in Logs | User authentication attempts | 30 days (free), 30+ days (P1/P2) | Portal, Graph API, Log Analytics |
| Microsoft 365 Audit Logs | Exchange, SharePoint, Teams, OneDrive activity | 90 days (default), up to 365 days with add-on | Compliance Portal, Graph API, Purview |
| Azure Security Center | Security alerts, recommendations | 90 days (default) | Portal, API, Log Analytics |
| VM Disk Snapshots | Managed disk images | Manual or automated | Portal, CLI, PowerShell, Backup |
🛠️ Azure Forensic Tools & Commands
# Install Azure CLI
curl -sL https://aka.ms/InstallAzureCLIDeb | sudo bash
az login

# Capture Activity Logs
az monitor activity-log list \
    --start-time 2024-01-01 \
    --end-time 2024-01-15 \
    --output json > activity_logs.json

# Capture specific resource logs
az monitor diagnostic-settings show \
    --resource /subscriptions/{sub-id}/resourceGroups/{rg}/providers/Microsoft.Compute/virtualMachines/{vm-name} \
    --name forensic-diagnostic > diagnostic_settings.json

# Query Log Analytics workspace
az monitor log-analytics query \
    --workspace workspace-id \
    --analytics-query "SecurityEvent | where TimeGenerated > ago(30d) | where EventID == 4625" \
    --output json > failed_logins.json

# Capture Azure AD sign-in logs
az rest \
    --method GET \
    --url "https://graph.microsoft.com/v1.0/auditLogs/signIns" \
    --headers "Content-Type=application/json" \
    --output json > signin_logs.json

# Create VM disk snapshot
az snapshot create \
    --resource-group forensic-rg \
    --name forensic-snapshot \
    --source /subscriptions/{sub-id}/resourceGroups/{rg}/providers/Microsoft.Compute/disks/{disk-name}

# Export snapshot to storage account
az snapshot grant-access \
    --resource-group forensic-rg \
    --name forensic-snapshot \
    --duration-in-seconds 3600 \
    --query accessSas

# Capture Microsoft 365 audit logs (PowerShell)
Connect-ExchangeOnline
Search-UnifiedAuditLog \
    -StartDate 01/01/2024 \
    -EndDate 01/15/2024 \
    -ResultSize 5000 \
    -OutputFilter "Operation -eq 'Send'" > email_sent_logs.csv

# Capture Azure Security Center alerts
az security alert list \
    --query "[?properties.severity=='High']" \
    --output json > high_severity_alerts.json
🟢 Google Cloud Platform (GCP) Forensics
📋 GCP Evidence Sources
| Service | Evidence Type | Retention | Acquisition Method |
|---|---|---|---|
| Cloud Audit Logs | Admin activity, data access, system events | Admin: 400 days; Data Access: configurable | Console, CLI, API, Log Explorer |
| VPC Flow Logs | Network traffic metadata | Configurable (days to years) | Console, CLI, Logging, BigQuery |
| Cloud Storage Logs | Object access history | Configurable | Storage, Logging, BigQuery | Compute Engine Serial Logs | VM console output | Configurable (default 1 day) | Console, CLI, Logging | Cloud SQL Logs | Database query logs, error logs | Configurable | Console, CLI, Logging |
| Security Command Center | Security findings, threats | 90 days (findings) | Console, API, Pub/Sub |
🛠️ GCP Forensic Tools & Commands
# Install Google Cloud SDK
curl https://sdk.cloud.google.com | bash
gcloud init

# Capture Cloud Audit Logs
gcloud logging read \
    "logName:projects/forensic-project/logs/cloudaudit.googleapis.com%2Factivity" \
    --limit 1000 \
    --format json > audit_logs.json

# Export logs to BigQuery for analysis
gcloud logging sinks create forensic-sink \
    bigquery.googleapis.com/projects/forensic-project/datasets/forensic_logs \
    --log-filter='severity>=ERROR'

# Capture VPC Flow Logs
gcloud logging read \
    "logName:projects/forensic-project/logs/compute.googleapis.com%2Fvpc_flows" \
    --limit 1000 \
    --format json > vpc_flows.json

# Create Compute Engine disk snapshot
gcloud compute snapshots create forensic-snapshot \
    --source-disk vm-disk-1 \
    --source-disk-zone us-central1-a \
    --description "Forensic snapshot for case INV-2024-001"

# Export disk snapshot to Cloud Storage
gcloud compute images export \
    --destination-uri gs://forensic-bucket/snapshot-image.vmdk \
    --source-image forensic-snapshot \
    --export-format vmdk

# Capture Cloud Storage object metadata
gsutil ls -L gs://suspect-bucket/ > storage_metadata.txt
gsutil stat gs://suspect-bucket/suspect-file.pdf > object_details.json

# Capture IAM policy
gcloud projects get-iam-policy forensic-project \
    --format json > iam_policy.json

# Capture Security Command Center findings
gcloud scc findings list \
    --organization organizations/123456789 \
    --filter 'severity="HIGH"' \
    --format json > security_findings.json

# Capture Compute Engine instance metadata
gcloud compute instances describe suspect-vm \
    --zone us-central1-a \
    --format json > vm_metadata.json
📊 Cross-Provider Evidence Comparison
| Evidence Type | AWS | Azure | GCP |
|---|---|---|---|
| API Activity Logs | CloudTrail | Activity Logs | Cloud Audit Logs |
| Network Flow Logs | VPC Flow Logs | NSG Flow Logs | VPC Flow Logs |
| Disk Snapshots | EBS Snapshots | Managed Disk Snapshots | Persistent Disk Snapshots |
| Security Alerts | GuardDuty | Security Center | Security Command Center |
| User Authentication | IAM + CloudTrail | Azure AD Sign-ins | Cloud Identity + Audit Logs |
29.3 API Logs and Access Trails
🔍 Understanding API Logs in Cloud Forensics
API logs (access trails) are the primary source of forensic evidence in cloud environments. They record every API call made to cloud resources, providing a detailed audit trail of user and system activity.
📋 What API Logs Capture
🔹 Identity Information
- User identity: IAM user/role, service account, federated user
- Source IP address: Origin of the API call
- User agent: Client application or SDK used
- Authentication method: Key, token, MFA status
🔹 Action Information
- Service name: EC2, S3, Compute Engine, etc.
- Action name: CreateInstance, DeleteObject, etc.
- Resource ARN/ID: Specific resource affected
- Request parameters: Input values (may contain sensitive data)
🔹 Result Information
- Response status: Success or failure (HTTP status code)
- Error code: Specific error message if failed
- Response elements: Output of the API call
- Request ID: Unique identifier for the call
🔹 Temporal Information
- Timestamp: Exact time of API call (UTC)
- Event time: When the event was recorded
- Region: Geographic region where the call was processed
🔍 Forensic Analysis of API Logs
Common Forensic Queries
# AWS CloudTrail - Find all API calls by a specific user
SELECT * FROM cloudtrail_logs
WHERE userIdentity.userName = 'suspected_user'
ORDER BY eventTime DESC;

# AWS CloudTrail - Find failed API calls (potential attacks)
SELECT eventName, errorCode, errorMessage, COUNT(*) as attempts
FROM cloudtrail_logs
WHERE errorCode IS NOT NULL
GROUP BY eventName, errorCode, errorMessage
ORDER BY attempts DESC;

# AWS CloudTrail - Find data exfiltration patterns
SELECT * FROM cloudtrail_logs
WHERE eventName IN ('GetObject', 'DownloadDBLogFilePortion', 'CopyObject')
AND userIdentity.userName = 'suspected_user';

# Azure - Find sign-ins from unusual locations
SELECT * FROM SigninLogs
WHERE IPAddress NOT IN ('known_ip_range')
AND ResultType != 0;

# Azure - Find privileged role assignments
SELECT * from AuditLogs
WHERE OperationName = 'Add member to role'
AND TargetResources[0].displayName LIKE '%Global Administrator%';

# GCP - Find Compute Engine instance creation
SELECT * FROM cloudaudit_googleapis_com_activity
WHERE protoPayload.methodName LIKE '%compute.instances.insert%'
ORDER BY timestamp DESC;

# GCP - Find sensitive data access in Cloud Storage
SELECT * FROM cloudaudit_googleapis_com_data_access
WHERE protoPayload.methodName = 'storage.objects.get'
AND protoPayload.authenticationInfo.principalEmail = 'suspicious@example.com';
📊 Suspicious API Patterns to Detect
| Pattern | Indicators | Potential Attack | ||||||||||||||||||||||||||||||||||||||||||||||||||||||||||||||||||||||||||||||||||||||||||||||||||||||||||||||||||||||||||||||||||||||||||||||||||||||||||||||||||||||||||||||||||||||||||||||||||||||||||||||||||||||||||||||||||||||||||||||||||||||||||||||||||||||||||||||||||||||||||||||||||||||||||||||||||||||||||||||||||||||||||||||||||||||||||||||||||||||||||||||||||||||||||||||||||||||||||||||||||||||||
|---|---|---|---|---|---|---|---|---|---|---|---|---|---|---|---|---|---|---|---|---|---|---|---|---|---|---|---|---|---|---|---|---|---|---|---|---|---|---|---|---|---|---|---|---|---|---|---|---|---|---|---|---|---|---|---|---|---|---|---|---|---|---|---|---|---|---|---|---|---|---|---|---|---|---|---|---|---|---|---|---|---|---|---|---|---|---|---|---|---|---|---|---|---|---|---|---|---|---|---|---|---|---|---|---|---|---|---|---|---|---|---|---|---|---|---|---|---|---|---|---|---|---|---|---|---|---|---|---|---|---|---|---|---|---|---|---|---|---|---|---|---|---|---|---|---|---|---|---|---|---|---|---|---|---|---|---|---|---|---|---|---|---|---|---|---|---|---|---|---|---|---|---|---|---|---|---|---|---|---|---|---|---|---|---|---|---|---|---|---|---|---|---|---|---|---|---|---|---|---|---|---|---|---|---|---|---|---|---|---|---|---|---|---|---|---|---|---|---|---|---|---|---|---|---|---|---|---|---|---|---|---|---|---|---|---|---|---|---|---|---|---|---|---|---|---|---|---|---|---|---|---|---|---|---|---|---|---|---|---|---|---|---|---|---|---|---|---|---|---|---|---|---|---|---|---|---|---|---|---|---|---|---|---|---|---|---|---|---|---|---|---|---|---|---|---|---|---|---|---|---|---|---|---|---|---|---|---|---|---|---|---|---|---|---|---|---|---|---|---|---|---|---|---|---|---|---|---|---|---|---|---|---|---|---|---|---|---|---|---|---|---|---|---|---|---|---|---|---|---|---|---|---|---|---|---|---|---|---|---|---|---|---|---|---|---|---|---|---|---|---|---|---|---|---|---|---|---|---|---|---|---|---|---|---|---|---|---|---|---|---|---|---|---|---|---|---|---|---|---|---|---|---|---|---|---|---|---|---|---|---|
| Rapid Instance Creation | High volume of RunInstances/CreateVM calls | Cryptominer deployment, Botnet creation | ||||||||||||||||||||||||||||||||||||||||||||||||||||||||||||||||||||||||||||||||||||||||||||||||||||||||||||||||||||||||||||||||||||||||||||||||||||||||||||||||||||||||||||||||||||||||||||||||||||||||||||||||||||||||||||||||||||||||||||||||||||||||||||||||||||||||||||||||||||||||||||||||||||||||||||||||||||||||||||||||||||||||||||||||||||||||||||||||||||||||||||||||||||||||||||||||||||||||||||||||||||||||
| Failed Access Attempts | Repeated GetObject/ListBuckets with AccessDenied | Reconnaissance, Credential testing | ||||||||||||||||||||||||||||||||||||||||||||||||||||||||||||||||||||||||||||||||||||||||||||||||||||||||||||||||||||||||||||||||||||||||||||||||||||||||||||||||||||||||||||||||||||||||||||||||||||||||||||||||||||||||||||||||||||||||||||||||||||||||||||||||||||||||||||||||||||||||||||||||||||||||||||||||||||||||||||||||||||||||||||||||||||||||||||||||||||||||||||||||||||||||||||||||||||||||||||||||||||||||
| Privilege Escalation | AttachPolicy, CreateUserAccessKey, iam:PassRole | Account takeover, Lateral movement | ||||||||||||||||||||||||||||||||||||||||||||||||||||||||||||||||||||||||||||||||||||||||||||||||||||||||||||||||||||||||||||||||||||||||||||||||||||||||||||||||||||||||||||||||||||||||||||||||||||||||||||||||||||||||||||||||||||||||||||||||||||||||||||||||||||||||||||||||||||||||||||||||||||||||||||||||||||||||||||||||||||||||||||||||||||||||||||||||||||||||||||||||||||||||||||||||||||||||||||||||||||||||
| Data Exfiltration | Large GetObject/Download operations, CreateSnapshot | Data theft, Intellectual property loss | ||||||||||||||||||||||||||||||||||||||||||||||||||||||||||||||||||||||||||||||||||||||||||||||||||||||||||||||||||||||||||||||||||||||||||||||||||||||||||||||||||||||||||||||||||||||||||||||||||||||||||||||||||||||||||||||||||||||||||||||||||||||||||||||||||||||||||||||||||||||||||||||||||||||||||||||||||||||||||||||||||||||||||||||||||||||||||||||||||||||||||||||||||||||||||||||||||||||||||||||||||||||||
| Resource Hijacking | CreateLaunchTemplate, ModifySecurityGroup | Resource takeover, Cryptojacking | ||||||||||||||||||||||||||||||||||||||||||||||||||||||||||||||||||||||||||||||||||||||||||||||||||||||||||||||||||||||||||||||||||||||||||||||||||||||||||||||||||||||||||||||||||||||||||||||||||||||||||||||||||||||||||||||||||||||||||||||||||||||||||||||||||||||||||||||||||||||||||||||||||||||||||||||||||||||||||||||||||||||||||||||||||||||||||||||||||||||||||||||||||||||||||||||||||||||||||||||||||||||||
| Log Deletion | DeleteTrail, DeleteLogGroup, StopLogging | Anti-forensics, Covering tracks | ||||||||||||||||||||||||||||||||||||||||||||||||||||||||||||||||||||||||||||||||||||||||||||||||||||||||||||||||||||||||||||||||||||||||||||||||||||||||||||||||||||||||||||||||||||||||||||||||||||||||||||||||||||||||||||||||||||||||||||||||||||||||||||||||||||||||||||||||||||||||||||||||||||||||||||||||||||||||||||||||||||||||||||||||||||||||||||||||||||||||||||||||||||||||||||||||||||||||||||||||||||||||
| Challenge | IaaS | PaaS | SaaS |
|---|---|---|---|
| Evidence Isolation | Moderate – VMs are isolated | High – Shared platform | Very High – Shared application |
| Data Remanence | Moderate – Disk wiping policies | High – Database remnants | High – File remnants in storage |
| Physical Access | High – No physical access | Very High – No physical access | Very High – No physical access |
| Investigator Control | Moderate – VM-level control | Low – Platform-level only | Very Low – Application-level only |
🛡️ Mitigation Strategies for Multi-tenancy Challenges
✅ Provider-Side Mitigations
- Logical Isolation: Virtual networks, security groups, IAM policies
- Encryption: Data encrypted at rest and in transit
- API-Based Access: Evidence collection via APIs, not hardware access
- Compliance Certifications: SOC 2, ISO 27001, FedRAMP, PCI DSS
- Forensic Readiness: Built-in logging and audit capabilities
✅ Tenant-Side Mitigations
- Enable All Logs: CloudTrail, Activity Logs, Audit Logs
- Export Logs Externally: Send logs to separate account or third-party SIEM
- Immutable Storage: Enable object lock or WORM policies
- Encryption Keys: Use customer-managed keys (CMK) for control
- Incident Response Plan: Document cloud-specific procedures
29.5 Legal and Jurisdictional Issues in Cloud Forensics
⚖️ Legal Complexity in the Cloud
Cloud computing introduces significant legal challenges because data may be stored, processed, and replicated across multiple geographic regions and countries, each with different laws and regulations.
🌍 Key Jurisdictional Challenges
1. Cross-Border Data Access
Data may be stored in multiple countries, each with different laws regarding data access.
- Challenge: Legal authority in one country may not extend to data in another
- Example: US warrant cannot compel data stored on servers in Germany
- Solution: MLAT (Mutual Legal Assistance Treaty) requests
2. Data Sovereignty
Data is subject to the laws of the country where it is physically stored.
- Challenge: Different countries have different data protection laws
- Example: GDPR applies to EU citizen data regardless of storage location
- Solution: Choose cloud regions carefully for compliance
3. CLOUD Act (US)
US law enforcement can compel US-based providers to disclose data regardless of storage location.
- Challenge: Conflicts with foreign data protection laws
- Example: Microsoft Ireland case precedent
- Solution: Legal challenges, executive agreements
4. Service Provider Terms of Service
Cloud providers' ToS govern data access and evidence preservation.
- Challenge: ToS may limit forensic access
- Example: Some providers require legal process for data export
- Solution: Understand provider policies before incidents
📜 Key Legal Frameworks & Regulations
| Regulation | Jurisdiction | Cloud Forensic Impact |
|---|---|---|
| GDPR | European Union | Data subjects have right to access, rectify, erase data. Data breach notification within 72 hours. |
| CLOUD Act | United States | US providers must disclose data regardless of storage location (subject to legal challenges). |
| CCPA/CPRA | California, USA | Consumers have right to know, delete, opt-out of data sale. Similar to GDPR. |
| HIPAA | United States | Protected health information (PHI) has strict access and breach notification requirements. |
| PCI DSS | Global | Credit card data storage and transmission requirements. Breach reporting. |
| eDiscovery Rules (FRCP) | United States | Parties must preserve relevant electronically stored information (ESI). |
📋 Legal Process for Cloud Evidence Collection
Identify
Provider & RegionLegal Authority
Warrant/SubpoenaPreservation Order
Prevent deletionLegal Request
To ProviderEvidence Production
Provider ResponseChain of Custody
Documentation📋 Provider Legal Request Portals
| Provider | Legal Portal | Acceptable Process |
|---|---|---|
| AWS | aws.amazon.com/compliance/legal-requests/ | Subpoena, Search Warrant, Court Order |
| Microsoft Azure | microsoft.com/en-us/corporate-responsibility/law-enforcement-requests-report | Subpoena, Search Warrant, Court Order | Google Cloud | support.google.com/transparencyreport/ | Subpoena, Search Warrant, Court Order |
| Salesforce | salesforce.com/company/legal-requests/ | Subpoena, Search Warrant, Court Order |
| Dropbox | dropbox.com/legal/ law-enforcement-guidelines | Subpoena, Search Warrant, Court Order |
📋 Sample Legal Request Elements
Legal Request for Cloud Evidence must include:

1. Case Information
   - Case number and investigating agency
   - Contact information for investigator

2. Account Identification
   - Email address(es) associated with account
   - Account ID or customer number (if known)
   - IP addresses and timestamps for correlation

3. Time Range
   - Specific date range for evidence request
   - Or "all available data" for preservation

4. Data Requested
   - Account information (name, address, payment methods)
   - Login history (IP addresses, timestamps)
   - Activity logs (API calls, resource changes)
   - Stored content (files, emails, backups)
   - User-generated content

5. Legal Authority
   - Statute under which request is made
   - Judge signature and date
   - Jurisdictional basis
⚠️ Common Legal Pitfalls in Cloud Forensics
- Assuming US law applies globally: The CLOUD Act has limits and faces international challenges
- Not preserving evidence immediately: Cloud data can be deleted in seconds
- Ignoring provider terms of service: ToS may limit forensic access or data retention
- Failing to document chain of custody: Cloud evidence must be properly authenticated
- Not understanding data retention policies: Logs may be deleted after 30-90 days
- Assuming data is in one location: Data may be replicated across regions automatically
- MLAT (Mutual Legal Assistance Treaty): Formal government-to-government requests
- CLOUD Act Executive Agreements: Bilateral agreements for direct provider access
- Europol / INTERPOL: International police cooperation
- GDPR Article 48: Transfers of personal data based on international agreements
Memory Forensics (Deep Dive)
Memory Forensics is the analysis of volatile memory (RAM) to uncover evidence that is not available on disk. It is essential for detecting fileless malware, rootkits, hidden processes, encryption keys, and attacker command history. This module provides a comprehensive deep dive into RAM structure, acquisition methods, analysis techniques, and practical usage of the Volatility Framework.
Memory forensics can reveal evidence that exists only in RAM—never written to disk—making it critical for detecting sophisticated malware.
30.1 RAM Structure and Acquisition
🧠 Understanding RAM in Digital Forensics
Random Access Memory (RAM) is volatile storage that holds actively running programs, operating system data, network connections, and user activity. Because RAM loses all data when power is removed, memory acquisition must occur before system shutdown.
📊 RAM Structure Overview
🔹 Physical Memory Layout
- User Space: Application code and data, heap, stack
- Kernel Space: OS kernel, drivers, system structures
- Page Cache: Cached files and disk data
- Page Tables: Virtual-to-physical address mappings
- Kernel Structures: Process lists, network stacks, registry (Windows)
🔹 Virtual Memory Management
- Pages: Fixed-size memory blocks (typically 4KB on x86/x64)
- Page Tables: Map virtual addresses to physical frames
- Swap/Pagefile: Disk storage for memory pages (also contains evidence)
- Memory Mapped Files: Files loaded directly into memory
🔬 What Can Be Found in Memory
| Artifact Category | Examples | Forensic Value |
|---|---|---|
| Processes | Running processes, hidden processes, injected code | Detect malware, identify attacker tools, uncover rootkits | Network | Active connections, listening ports, DNS queries | Identify C2 communication, data exfiltration, attack sources |
| Credentials | Passwords, password hashes, Kerberos tickets, API keys | Account compromise evidence, lateral movement tracking | Command History | CMD, PowerShell, bash commands | Reconstruct attacker actions, identify executed commands |
| Files & Data | Open files, clipboard contents, decrypted documents | Access evidence, document content, temporary data |
| Kernel Artifacts | Loaded drivers, system calls, interrupt hooks | Detect rootkits, kernel-mode malware | Registry (Windows) | Registry hives loaded in memory | USB history, program execution, user activity |
📸 Memory Acquisition Methods
Method 1: FTK Imager (GUI)
File → Capture Memory → Select destination → CaptureMethod 2: DumpIt (Command Line)
# Run as Administrator
DumpIt.exe

# Output: memory.dmp (or similar)
Method 3: winpmem (Open Source)
# Download from GitHub
winpmem_2.1.exe output.mem

# With compression
winpmem_2.1.exe output.aff4
Method 4: Magnet RAM Capture (Free)
# Download from Magnet Forensics
# Run as Administrator, select capture locationMethod 1: LiME (Linux Memory Extractor)
# Clone and compile
git clone https://github.com/504ensicsLabs/LiME.git
cd LiME/src
make

# Load module and capture
sudo insmod lime.ko "path=output.mem format=raw"
Method 2: fmem (Open Source)
git clone https://github.com/NationalSecurityAgency/fmem.git
cd fmem
make
sudo insmod fmem.ko
sudo dd if=/dev/fmem of=memory.dump bs=1M
Method 3: AVML (Azure Memory Dump)
# Download from GitHub
./avml memory.lime
./avml memory.elfMethod 1: osxpmem
# Download from GitHub
sudo osxpmem -o output.mem
Method 2: Mac Memory Reader
# Free tool from Rekall
# Run as root, select capture locationVMware
# .vmem file contains memory
# Suspend VM or use snapshot
VirtualBox
# .sav file contains memory
VBoxManage debugvm "VM Name" dumpguestcore --filename memory.dump
Hyper-V
# Use DumpIt or winpmem inside VM✅ Memory Acquisition Best Practices
- Capture memory FIRST - Before any other forensic activity
- Document system time - Record system clock for timeline correlation
- Capture twice - If possible, capture at beginning and end of investigation
- Use write-blocker for disk - Don't write acquisition tool to suspect disk
- Verify hash values - Calculate MD5/SHA256 of memory dump
- Include pagefile - Pagefile.sys contains memory pages written to disk
- Document capture method - Record tool name, version, and parameters
# Calculate SHA-256 of memory dump
sha256sum memory.dump
a1b2c3d4e5f678901234567890abcdef1234567890abcdef1234567890abcdef  memory.dump

# Document in case notes
Memory Dump Hash: SHA256: a1b2c3d4e5f678901234567890abcdef1234567890abcdef1234567890abcdef
Capture Time: 2024-01-15 14:32:17 UTC
Capture Tool: winpmem_2.1.exe
Capture Parameters: output.mem
Captured By: Examiner J. Doe
30.2 Process Analysis and Hidden Processes
🔍 Analyzing Processes in Memory
Process analysis is the foundation of memory forensics. It reveals running programs, their parent-child relationships, loaded DLLs, command line arguments, and potential malicious activity.
📊 Process Structures in Memory
🔹 Windows (EPROCESS)
- EPROCESS: Executive process block - main process structure
- PEB: Process Environment Block - user-mode process data
- VAD: Virtual Address Descriptor - memory allocation map
- ETHREAD: Executive thread block - thread information
- DLL List: Loaded libraries for the process
🔹 Linux (task_struct)
- task_struct: Main process descriptor
- mm_struct: Memory management descriptor
- vm_area_struct: Virtual memory area descriptor
- files_struct: Open file descriptors
- fs_struct: Filesystem information
🕵️ Detecting Hidden Processes
🔹 Techniques Used by Rootkits
- DKOM (Direct Kernel Object Manipulation): Unlinking EPROCESS from active list
- Inline Hooking: Intercepting API calls that enumerate processes
- SSDT Hooking: Modifying System Service Dispatch Table
- IRP Hooking: Intercepting I/O Request Packets
- Process Hollowing: Creating legitimate process, replacing its code
🔹 Detection Methods
- Cross-view Detection: Compare multiple process listing sources
- Pool Scanning: Scan memory for EPROCESS structures
- Thread Analysis: Find threads without parent processes
- Handle Analysis: Find processes with open handles
- VAD Analysis: Identify anomalies in memory regions
🔧 Volatility Commands for Process Analysis
# Volatility 2 (Legacy)
# List processes (from active list)
volatility -f memory.dump --profile=Win10x64 pslist

# Scan for processes (including unlinked)
volatility -f memory.dump --profile=Win10x64 psscan

# Cross-view process listing (find hidden)
volatility -f memory.dump --profile=Win10x64 psxview

# Display process tree
volatility -f memory.dump --profile=Win10x64 pstree

# Show process command line
volatility -f memory.dump --profile=Win10x64 cmdline

# Show process environment variables
volatility -f memory.dump --profile=Win10x64 envars

# Show process DLLs
volatility -f memory.dump --profile=Win10x64 dlllist -p [PID]

# Dump process memory
volatility -f memory.dump --profile=Win10x64 procdump -p [PID] -D output/

# Volatility 3 (Modern)
vol -f memory.dump windows.pslist
vol -f memory.dump windows.psscan
vol -f memory.dump windows.pstree
vol -f memory.dump windows.cmdline
vol -f memory.dump windows.dlllist --pid [PID]
vol -f memory.dump windows.memdump --pid [PID] --dump
🎯 Practical Example: Finding Hidden Process
# Step 1: Get process list from active list
volatility -f suspect.dump --profile=Win10x64 pslist > pslist.txt

# Step 2: Scan for processes (catches unlinked)
volatility -f suspect.dump --profile=Win10x64 psscan > psscan.txt

# Step 3: Compare lists
diff pslist.txt psscan.txt

# Step 4: Look for processes in psscan but not pslist
# These are hidden processes (rootkit activity)

# Step 5: Examine suspicious hidden process
volatility -f suspect.dump --profile=Win10x64 cmdline --pid [HIDDEN_PID]
volatility -f suspect.dump --profile=Win10x64 dlllist --pid [HIDDEN_PID]

# Step 6: Dump hidden process for analysis
volatility -f suspect.dump --profile=Win10x64 procdump -p [HIDDEN_PID] -D extracted/
⚠️ Suspicious Process Indicators
| Indicator | Suspicious Pattern | Potential Threat | |
|---|---|---|---|
| Process Name | Random characters, masquerading (svchost.exe in wrong location) | Malware, RAT, Trojan | |
| Parent Process | Word/Excel spawning PowerShell, cmd.exe with no parent | Macro malware, Process hollowing | Command Line | Encoded PowerShell, downloading from suspicious URLs | Fileless malware, Downloader, C2 communication |
| Memory Regions | Executable memory in unexpected locations, RWX regions | Code injection, Shellcode | |
| Threads | Multiple threads with same start address, APC injection | Thread injection, Malware persistence |
30.3 Rootkit and Malware Detection in Memory
🦠 Detecting Malware in Memory
Memory forensics is the most effective way to detect fileless malware, rootkits, and sophisticated threats that never write to disk. This section covers techniques to identify malicious code in RAM.
🔬 Malware Detection Techniques in Memory
1. Code Injection Detection (malfind)
Identifies executable memory regions that are not backed by a file on disk (indicating injected code).
- PAGE_EXECUTE_READWRITE (RWX) memory regions
- MZ/PE headers in unexpected locations
- Known shellcode patterns
2. Process Hollowing Detection
Detects when a legitimate process has been hollowed out and replaced with malicious code.
- PEB.ImageBaseAddress mismatch
- Suspicious memory protection changes
- Entry point outside loaded image
3. API Hook Detection (apihooks)
Identifies modified API functions that intercept system calls.
- Inline hooks (JMP/CALL modifications)
- IAT/EAT hooks
- SSDT hooks (kernel-mode)
4. Callback Detection (callbacks)
Detects kernel callbacks used by rootkits for persistence and stealth.
- Process creation callbacks
- Thread creation callbacks
- Load image callbacks
- Object type callbacks
🔧 Volatility Commands for Malware Detection
# Volatility 2
# Find injected code
volatility -f memory.dump --profile=Win10x64 malfind

# Find API hooks
volatility -f memory.dump --profile=Win10x64 apihooks

# Detect process hollowing
volatility -f memory.dump --profile=Win10x64 hollowfind

# Find kernel callbacks
volatility -f memory.dump --profile=Win10x64 callbacks

# Find orphan threads (process hollowing indicator)
volatility -f memory.dump --profile=Win10x64 threads

# Detect modified system service dispatch table
volatility -f memory.dump --profile=Win10x64 ssdt

# Find hidden modules/drivers
volatility -f memory.dump --profile=Win10x64 modscan
volatility -f memory.dump --profile=Win10x64 driverscan

# Volatility 3
vol -f memory.dump windows.malfind
vol -f memory.dump windows.apihooks
vol -f memory.dump windows.callbacks
vol -f memory.dump windows.ssdt
vol -f memory.dump windows.modscan
vol -f memory.dump windows.driverscan
🎯 Practical Example: Finding Injected Code
# Step 1: Run malfind to find injected code
volatility -f suspect.dump --profile=Win10x64 malfind > malfind.txt

# Step 2: Review output for suspicious regions
# Look for:
# - Protection: PAGE_EXECUTE_READWRITE (RWX)
# - No mapped file (not backed by DLL/EXE)
# - Suspicious content (MZ header, shellcode patterns)

# Step 3: Extract suspicious regions
volatility -f suspect.dump --profile=Win10x64 malfind --dump

# Step 4: Analyze dumped code
# Use strings, hexdump, or disassembler
strings extracted.0x[address].dmp | head -20

# Step 5: Check process hierarchy
volatility -f suspect.dump --profile=Win10x64 pstree -p [PID]

# Step 6: Check network connections from suspicious process
volatility -f suspect.dump --profile=Win10x64 netscan | grep [PID]
📊 Malware Indicators in Memory
| Indicator | Volatility Plugin | Malware Technique |
|---|---|---|
| RWX memory regions without mapped file | malfind | Code injection, Shellcode | Entry point outside image | hollowfind, ldrmodules | Process hollowing |
| API function modifications | apihooks, ssdt | API hooking, Rootkits |
| Unknown driver modules | modscan, driverscan | Kernel rootkits, Malware drivers |
| Suspicious callbacks | callbacks | Persistence, Process monitoring |
| Suspicious thread start addresses | threads, malfind | APC injection, Thread injection |
30.4 Network Connections and Sockets
🌐 Network Forensics in Memory
Network artifacts in memory reveal active connections, listening ports, DNS queries, and communication with command-and-control (C2) servers. This evidence is often not captured in network logs.
📡 Network Artifacts in Memory
🔹 TCP/UDP Connections
- Local/Remote IP and Port: Communication endpoints
- Connection State: LISTENING, ESTABLISHED, CLOSE_WAIT
- Process ID (PID): Which process owns the connection
- Process Name: Executable associated with connection
- Creation Time: When connection was established
🔹 DNS Queries
- Query Domain: Domain name being resolved
- Query Type: A, AAAA, CNAME, MX, TXT
- Response IP: Resolved IP address
- Timestamp: When query occurred
- Process PID: Which process made the query
🔹 Sockets
- Local Address: Bound IP and port
- Protocol: TCP, UDP, RAW
- Socket Type: Stream, Datagram
- Process Owner: PID of socket owner
🔹 ARP Cache
- IP Address: Target IP
- MAC Address: Hardware address
- Interface: Network adapter
- Type: Static/Dynamic
🔧 Volatility Commands for Network Analysis
# Volatility 2
# List network connections
volatility -f memory.dump --profile=Win10x64 netscan

# List sockets (older Windows)
volatility -f memory.dump --profile=Win10x64 sockets
volatility -f memory.dump --profile=Win10x64 connscan

# List DNS cache
volatility -f memory.dump --profile=Win10x64 dns

# List ARP cache
volatility -f memory.dump --profile=Win10x64 arp

# Volatility 3
vol -f memory.dump windows.netscan
vol -f memory.dump windows.dns
vol -f memory.dump windows.arp

# Linux memory analysis
vol -f linux.dump linux.netstat
vol -f linux.dump linux.arp
vol -f linux.dump linux.route
🎯 Practical Example: Detecting C2 Communication
# Step 1: Extract all network connections
volatility -f suspect.dump --profile=Win10x64 netscan > network.txt

# Step 2: Look for established connections to external IPs
cat network.txt | grep "ESTABLISHED" | grep -v "192.168." | grep -v "10." | grep -v "172."

# Step 3: Identify suspicious ports
cat network.txt | grep -E ":4444|:1337|:6667|:8080"

# Step 4: Check process details for suspicious connections
volatility -f suspect.dump --profile=Win10x64 cmdline --pid [PID]
volatility -f suspect.dump --profile=Win10x64 dlllist --pid [PID]

# Step 5: Extract DNS queries
volatility -f suspect.dump --profile=Win10x64 dns > dns.txt

# Step 6: Look for DGA domains (random-looking names)
cat dns.txt | grep -E "[a-z0-9]{16,}\.com|[a-z0-9]{16,}\.net"

# Step 7: Timeline correlation
# Match network connections with process creation times
volatility -f suspect.dump --profile=Win10x64 pslist | grep [PID]
📊 Suspicious Network Indicators
| Indicator | Suspicious Pattern | Potential Threat |
|---|---|---|
| Ports | 4444, 1337, 6667, 31337, 5555, 8080 | Metasploit, Netcat, IRC bots, Proxy |
| Connection State | LISTENING on unusual ports, ESTABLISHED to unknown IPs | Backdoor, C2 server, Data exfiltration |
| DNS Queries | DGA domains, random subdomains, TXT record queries | Malware beaconing, DNS tunneling |
| Process Names | svchost.exe, lsass.exe, explorer.exe making network connections | 许多人Process hollowing, DLL injection|
| Multiple Connections | Same process connecting to multiple external IPs | Scanning, Propagation, Data theft |
30.5 Volatility Framework Usage – Complete Reference
🔧 Volatility Framework Overview
Volatility is the most advanced open-source memory forensics framework. It supports Windows, Linux, macOS, and Android memory dumps with hundreds of analysis plugins.
📥 Volatility Installation
Method 1: APT (Volatility 2)
sudo apt install volatility -yMethod 2: Pip (Volatility 3)
pip3 install volatility3Method 3: From GitHub
git clone https://github.com/volatilityfoundation/volatility3.git
cd volatility3
python3 vol.py -hStandalone Executable
# Download from volatilityfoundation.org
# Extract to folder
# Run from Command Prompt
Volatility 3 with Python
# Install Python 3
pip install volatility3
vol -f memory.dump windows.info
🔍 Profile Detection (Volatility 2)
# Identify correct profile
volatility -f memory.dump imageinfo

# Sample output:
# Suggested Profile(s) : Win10x64_19041, Win10x64_18362, Win10x64_17763
#                     : Win10x64_17134, Win10x64_16299

# Use identified profile
volatility -f memory.dump --profile=Win10x64_19041 pslist
📋 Essential Volatility Plugins Reference
| Category | Plugin | Purpose | Command (Vol3) |
|---|---|---|---|
| Process Analysis | |||
| Process | pslist | List processes from active list | windows.pslist |
| Process | psscan | Scan for processes (catches hidden) | windows.psscan |
| Process | pstree | Display process tree | windows.pstree |
| Process | cmdline | Command line arguments | windows.cmdline |
| Process | dlllist | List loaded DLLs | windows.dlllist |
| Malware Detection | |||
| Malware | malfind | Find injected code | windows.malfind |
| Malware | apihooks | Detect API hooks | windows.apihooks |
| Malware | hollowfind | Detect process hollowing | windows.hollowfind |
| Network Analysis | |||
| Network | netscan | Network connections and sockets | windows.netscan |
| Network | dns | DNS cache | windows.dns |
| Files & Registry | |||
| Files | filescan | Scan for file objects | windows.filescan |
| Registry | hivelist | List registry hives | windows.registry.hivelist |
| Registry | printkey | Print registry key values | windows.registry.printkey |
Registry | hashdump | Extract password hashes | windows.hashdump |
| Kernel & Drivers | |||
| Kernel | modules | List loaded kernel modules | windows.modules |
| Kernel | driverscan | Scan for driver objects | windows.driverscan |
| Kernel | callbacks | List kernel callbacks | windows.callbacks |
| Timeline | |||
| Timeline | timeliner | Create timeline from memory | windows.timeliner |
🎯 Practical Volatility Workflow
# ========== COMPLETE MEMORY ANALYSIS WORKFLOW ==========

# 1. Identify OS profile (Volatility 2)
volatility -f memory.dump imageinfo

# 2. Get system information
vol -f memory.dump windows.info

# 3. List all processes
vol -f memory.dump windows.pslist > processes.txt
vol -f memory.dump windows.psscan >> processes.txt

# 4. Check for hidden processes (compare pslist vs psscan)
diff processes.txt psscan.txt

# 5. Display process tree
vol -f memory.dump windows.pstree

# 6. Extract command lines
vol -f memory.dump windows.cmdline > cmdline.txt

# 7. Find injected code
vol -f memory.dump windows.malfind > malfind.txt

# 8. List network connections
vol -f memory.dump windows.netscan > network.txt

# 9. Extract DNS queries
vol -f memory.dump windows.dns > dns.txt

# 10. Scan for files
vol -f memory.dump windows.filescan > filescan.txt

# 11. Extract password hashes
vol -f memory.dump windows.hashdump > hashes.txt

# 12. Create timeline
vol -f memory.dump windows.timeliner --output=csv --output-file=timeline.csv

# 13. Dump suspicious processes
vol -f memory.dump windows.memdump --pid [PID] --dump

# 14. Extract registry hives
vol -f memory.dump windows.registry.hivelist
vol -f memory.dump windows.registry.dumpregistry
📊 Volatility 2 vs Volatility 3 Comparison
| Feature | Volatility 2 (Legacy) | Volatility 3 (Modern) |
|---|---|---|
| Profile Detection | Manual (imageinfo plugin) | Automatic (symbol tables) |
| Plugin Syntax | volatility -f dump --profile=Win10x64 pslist |
vol -f dump windows.pslist |
| Plugin Organization | Flat namespace | Organized by OS (windows., linux., mac.) |
| Symbol Tables | Requires profile generation | Downloads automatically |
| Python Version | Python 2 only | Python 3 only |
| Development | Legacy (maintenance only) | Active development |
Memory forensics should only be performed on evidence you have legal authority to examine. Memory dumps may contain decrypted passwords, private keys, and sensitive user data. Always maintain proper chain of custody and document all analysis steps.
Malware Forensics
Malware Forensics is the discipline of analyzing malicious software to understand its capabilities, origin, intent, and impact. It combines static analysis (examining code without executing it) and dynamic analysis (executing malware in controlled environments) to extract indicators of compromise, identify attacker infrastructure, and develop detection signatures.
Malware analysis is essential for incident response, threat intelligence, and building defensive capabilities against cyber threats.
31.1 Malware Classification
🦠 Understanding Malware Types
Malware (Malicious Software) encompasses various types of hostile or intrusive software designed to damage, disrupt, or gain unauthorized access to computer systems. Understanding malware classification helps analysts quickly identify threat vectors and appropriate analysis techniques.
📊 Major Malware Categories
| Category | Description | Examples | Forensic Indicators | |||||||||||||||||||||||||||||||||||||||||||||||||||||||||||||||||||||||||||||||||||||||||||||||||||||||||||||||||||||||||||||||||||||||||||||||||||||||||||||||||||||||||||||||||||||||||||||||||||||||||||||||||||||||||||||||||||||||||||||||||||||||||||||||||||||||||||||||||||||||||||||||||||||||||||||||||||||||||||||||||||||||||||||||||||||||||||||||||||||||||||||||||||||||||||||||||||||||||||||||||||||||
|---|---|---|---|---|---|---|---|---|---|---|---|---|---|---|---|---|---|---|---|---|---|---|---|---|---|---|---|---|---|---|---|---|---|---|---|---|---|---|---|---|---|---|---|---|---|---|---|---|---|---|---|---|---|---|---|---|---|---|---|---|---|---|---|---|---|---|---|---|---|---|---|---|---|---|---|---|---|---|---|---|---|---|---|---|---|---|---|---|---|---|---|---|---|---|---|---|---|---|---|---|---|---|---|---|---|---|---|---|---|---|---|---|---|---|---|---|---|---|---|---|---|---|---|---|---|---|---|---|---|---|---|---|---|---|---|---|---|---|---|---|---|---|---|---|---|---|---|---|---|---|---|---|---|---|---|---|---|---|---|---|---|---|---|---|---|---|---|---|---|---|---|---|---|---|---|---|---|---|---|---|---|---|---|---|---|---|---|---|---|---|---|---|---|---|---|---|---|---|---|---|---|---|---|---|---|---|---|---|---|---|---|---|---|---|---|---|---|---|---|---|---|---|---|---|---|---|---|---|---|---|---|---|---|---|---|---|---|---|---|---|---|---|---|---|---|---|---|---|---|---|---|---|---|---|---|---|---|---|---|---|---|---|---|---|---|---|---|---|---|---|---|---|---|---|---|---|---|---|---|---|---|---|---|---|---|---|---|---|---|---|---|---|---|---|---|---|---|---|---|---|---|---|---|---|---|---|---|---|---|---|---|---|---|---|---|---|---|---|---|---|---|---|---|---|---|---|---|---|---|---|---|---|---|---|---|---|---|---|---|---|---|---|---|---|---|---|---|---|---|---|---|---|---|---|---|---|---|---|---|---|---|---|---|---|---|---|---|---|---|---|---|---|---|---|---|---|---|---|---|---|---|---|---|---|---|---|---|---|---|---|---|---|---|---|---|---|---|---|---|---|---|---|---|---|---|---|---|---|---|---|
| Virus | Self-replicating code that attaches to clean files | CIH, Melissa, ILOVEYOU | Modified file sizes, unusual file permissions | |||||||||||||||||||||||||||||||||||||||||||||||||||||||||||||||||||||||||||||||||||||||||||||||||||||||||||||||||||||||||||||||||||||||||||||||||||||||||||||||||||||||||||||||||||||||||||||||||||||||||||||||||||||||||||||||||||||||||||||||||||||||||||||||||||||||||||||||||||||||||||||||||||||||||||||||||||||||||||||||||||||||||||||||||||||||||||||||||||||||||||||||||||||||||||||||||||||||||||||||||||||||
| Worm | Self-replicates across networks without user action | Morris, Code Red, Conficker, WannaCry | Network scans, unusual outbound connections, mass email | |||||||||||||||||||||||||||||||||||||||||||||||||||||||||||||||||||||||||||||||||||||||||||||||||||||||||||||||||||||||||||||||||||||||||||||||||||||||||||||||||||||||||||||||||||||||||||||||||||||||||||||||||||||||||||||||||||||||||||||||||||||||||||||||||||||||||||||||||||||||||||||||||||||||||||||||||||||||||||||||||||||||||||||||||||||||||||||||||||||||||||||||||||||||||||||||||||||||||||||||||||||||
| Trojan Horse | Disguised as legitimate software, requires user execution | Zeus, Emotet, TrickBot, Remote Access Trojans (RATs) | Unexpected network connections, modified registry, new services | |||||||||||||||||||||||||||||||||||||||||||||||||||||||||||||||||||||||||||||||||||||||||||||||||||||||||||||||||||||||||||||||||||||||||||||||||||||||||||||||||||||||||||||||||||||||||||||||||||||||||||||||||||||||||||||||||||||||||||||||||||||||||||||||||||||||||||||||||||||||||||||||||||||||||||||||||||||||||||||||||||||||||||||||||||||||||||||||||||||||||||||||||||||||||||||||||||||||||||||||||||||||
| Ransomware | Encrypts files and demands payment for decryption | WannaCry, Ryuk, LockBit, REvil, Conti | File extensions changed, ransom notes, file encryption activity | |||||||||||||||||||||||||||||||||||||||||||||||||||||||||||||||||||||||||||||||||||||||||||||||||||||||||||||||||||||||||||||||||||||||||||||||||||||||||||||||||||||||||||||||||||||||||||||||||||||||||||||||||||||||||||||||||||||||||||||||||||||||||||||||||||||||||||||||||||||||||||||||||||||||||||||||||||||||||||||||||||||||||||||||||||||||||||||||||||||||||||||||||||||||||||||||||||||||||||||||||||||||
| Spyware | Secretly monitors user activity and steals data | FinFisher, Pegasus, keyloggers, banking trojans | Keystroke logging, screen captures, data exfiltration | |||||||||||||||||||||||||||||||||||||||||||||||||||||||||||||||||||||||||||||||||||||||||||||||||||||||||||||||||||||||||||||||||||||||||||||||||||||||||||||||||||||||||||||||||||||||||||||||||||||||||||||||||||||||||||||||||||||||||||||||||||||||||||||||||||||||||||||||||||||||||||||||||||||||||||||||||||||||||||||||||||||||||||||||||||||||||||||||||||||||||||||||||||||||||||||||||||||||||||||||||||||||
| Adware | Displays unwanted advertisements | Fireball, DeskAd, Superfish | Browser redirects, pop-ups, new browser extensions | |||||||||||||||||||||||||||||||||||||||||||||||||||||||||||||||||||||||||||||||||||||||||||||||||||||||||||||||||||||||||||||||||||||||||||||||||||||||||||||||||||||||||||||||||||||||||||||||||||||||||||||||||||||||||||||||||||||||||||||||||||||||||||||||||||||||||||||||||||||||||||||||||||||||||||||||||||||||||||||||||||||||||||||||||||||||||||||||||||||||||||||||||||||||||||||||||||||||||||||||||||||||
| Rootkit | Hides malicious activity from detection tools | Sony BMG rootkit, TDL4, ZeroAccess | Hidden processes, API hooks, DKOM anomalies | |||||||||||||||||||||||||||||||||||||||||||||||||||||||||||||||||||||||||||||||||||||||||||||||||||||||||||||||||||||||||||||||||||||||||||||||||||||||||||||||||||||||||||||||||||||||||||||||||||||||||||||||||||||||||||||||||||||||||||||||||||||||||||||||||||||||||||||||||||||||||||||||||||||||||||||||||||||||||||||||||||||||||||||||||||||||||||||||||||||||||||||||||||||||||||||||||||||||||||||||||||||||
| Bootkit | Infects boot sector or Master Boot Record | Mebroot, Olmarik, Gapz | јунуBoot sector modifications, early loading signatures||||||||||||||||||||||||||||||||||||||||||||||||||||||||||||||||||||||||||||||||||||||||||||||||||||||||||||||||||||||||||||||||||||||||||||||||||||||||||||||||||||||||||||||||||||||||||||||||||||||||||||||||||||||||||||||||||||||||||||||||||||||||||||||||||||||||||||||||||||||||||||||||||||||||||||||||||||||||||||||||||||||||||||||||||||||||||||||||||||||||||||||||||||||||||||||||||||||||||||||||||||||||
| Fileless Malware | јунуExecutes in memory without writing to diskKovter, Poweliks, Astaroth | PowerShell/WMI activity, registry-only persistence, memory artifacts | ||||||||||||||||||||||||||||||||||||||||||||||||||||||||||||||||||||||||||||||||||||||||||||||||||||||||||||||||||||||||||||||||||||||||||||||||||||||||||||||||||||||||||||||||||||||||||||||||||||||||||||||||||||||||||||||||||||||||||||||||||||||||||||||||||||||||||||||||||||||||||||||||||||||||||||||||||||||||||||||||||||||||||||||||||||||||||||||||||||||||||||||||||||||||||||||||||||||||||||||||||||||||
| Cryptominer | Uses system resources to mine cryptocurrency | Coinhive, XMRig, Crackonosh | High CPU usage, mining pool connections, miner executables | |||||||||||||||||||||||||||||||||||||||||||||||||||||||||||||||||||||||||||||||||||||||||||||||||||||||||||||||||||||||||||||||||||||||||||||||||||||||||||||||||||||||||||||||||||||||||||||||||||||||||||||||||||||||||||||||||||||||||||||||||||||||||||||||||||||||||||||||||||||||||||||||||||||||||||||||||||||||||||||||||||||||||||||||||||||||||||||||||||||||||||||||||||||||||||||||||||||||||||||||||||||||
| Target | Description | Examples |
|---|---|---|
| Desktop/Laptop | General-purpose malware for end-user systems | Emotet, Dridex, Ransomware |
| Server | Targets web servers, database servers, application servers | Web shells, Cobalt Strike, ransomware (Linux variants) | Mobile | Android and iOS malware | SpyNote, Pegasus, Anubis |
| IoT/Embedded | јунуTargets routers, cameras, smart devicesMirai, VPNFilter, Mozi | |
| Cloud | Targets cloud infrastructure and services | Denzel, Cloud Snooper, TeamTNT |
31.2 Static Analysis Techniques
🔬 Static Analysis Fundamentals
Static analysis examines malware without executing it. It is safe and can be performed on any system, but may not reveal runtime behaviors or obfuscated code. Static analysis is the first step in malware analysis.
🔍 Basic Static Analysis Techniques
1. File Type Identification
# Linux file command
file suspicious.exe
# Output: PE32 executable (GUI) Intel 80386, for MS Windows

# Detect It Easy (DIE)
# GUI tool for identifying packers and compilers2. Hash Calculation
# Calculate MD5, SHA-1, SHA-256
md5sum malware.exe
sha1sum malware.exe
sha256sum malware.exe

# Submit to VirusTotal
curl --form "file=@malware.exe" https://www.virustotal.com/api/v3/files3. Strings Extraction
# Extract ASCII strings
strings malware.exe > strings.txt

# Extract Unicode strings
strings -e l malware.exe >> strings.txt

# Extract minimum 8-character strings
strings -n 8 malware.exe > strings.txt

# Filter for URLs, IPs, file paths
cat strings.txt | grep -E "http|https|www|\.exe|\.dll|C:\\"4. Packer Detection
# Detect It Easy (DIE)
diec malware.exe

# PEiD (legacy)
peid malware.exe

# Exeinfo PE
# GUI tool for packer detection🔧 Advanced Static Analysis Techniques
5. PE (Portable Executable) Analysis
# PE Tools
# PE-bear, CFF Explorer, PEStudio

# Command line with pefile (Python)
import pefile
pe = pefile.PE("malware.exe")
print("Entry Point:", pe.OPTIONAL_HEADER.AddressOfEntryPoint)
print("Sections:")
for section in pe.sections:
    print(f"  {section.Name.decode().strip()} - {section.Misc_VirtualSize} bytes")

# Check imported functions
for entry in pe.DIRECTORY_ENTRY_IMPORT:
    print(f"Imported from: {entry.dll.decode()}")
    for imp in entry.imports:
print(f" {imp.name.decode() if imp.name else ''}")6. Resource Analysis
# Resource Hacker
# GUI tool to view and extract PE resources

# 7-Zip (can extract some PE resources)
7z l malware.exe

# Resource extraction with Python
import pefile
pe = pefile.PE("malware.exe")
for resource in pe.DIRECTORY_ENTRY_RESOURCE.entries:
print(f"Resource type: {resource.name}")7. Disassembly
# objdump (Linux)
objdump -d malware.exe > disassembly.txt

# radare2
r2 -A malware.exe
[0x00401000]> pdf @ entry0

# IDA Pro / Ghidra
# Load binary and analyze8. Import/Export Analysis
# List all imported functions
python -c "import pefile; pe = pefile.PE('malware.exe'); [print(f'{e.dll.decode()}: {imp.name.decode() if imp.name else \"\"}') for e in pe.DIRECTORY_ENTRY_IMPORT for imp in e.imports]"- Network: WinHttp, WinInet, URLDownloadToFile, WSASocket
- Process: CreateProcess, WinExec, ShellExecute, CreateRemoteThread
- File: WriteFile, CreateFile, DeleteFile, MoveFile
- Registry: RegCreateKey, RegSetValue, RegDeleteKey
- Persistence: SHGetFolderPath, CreateService, Schtasks
🛠️ Static Analysis Tools Reference
| Tool | Purpose | Platform | Key Features |
|---|---|---|---|
| Detect It Easy (DIE) | Packer detection, file identification | Windows/Linux/macOS | Identifies packers, compilers, cryptors |
| PE-bear | PE file analysis | Windows | Section viewer, import/export viewer, entropy calculator | CFF Explorer | PE file analysis | Windows | Full PE structure viewer, resource editor, hex editor |
| PEStudio | Malware analysis | Windows | Indicators of compromise, suspicious artifacts, VT integration |
| Ghidra | Disassembly, decompilation | Cross-platform | Free, NSA-developed, supports multiple architectures |
| IDA Pro | Disassembly, decompilation | Windows/Linux/macOS | Industry standard, powerful analysis, expensive |
| radare2 | Disassembly, reverse engineering | Cross-platform | Command-line, scriptable, free |
| Strings | String extraction | Cross-platform | Extracts ASCII and Unicode strings from binaries |
31.3 Dynamic Analysis (Sandboxing)
⚡ Dynamic Analysis Overview
Dynamic analysis involves executing malware in a controlled, isolated environment to observe its behavior. It reveals runtime activities including network communication, file system changes, registry modifications, and process creation—information not available through static analysis.
🖥️ Setting Up a Malware Analysis Lab
Virtualization Platforms
- VMware Workstation/Player: Industry standard, excellent snapshot support, hardware acceleration
- VirtualBox: Free, open-source, cross-platform, good for beginners
- Parallels Desktop: macOS virtualization
- Windows Sandbox: Built into Windows 10/11 Pro/Enterprise, lightweight
- QEMU/KVM: Open-source, supports multiple architectures
- VMware ESXi: Enterprise bare-metal hypervisor
- Microsoft Hyper-V: Windows Server virtualization
- AWS/Azure/GCP: Cloud-based analysis environments
Analysis Environment Configuration
Network Configuration
- Isolated Network: Host-only or NAT with no inbound/outbound internet
- INetSim/FakeNet-NG: Simulate network services (DNS, HTTP, HTTPS, SMTP)
- Host-Only Networking: Communication only with host (no external access)
- Internal Network: Communication only between VMs
Pre-configured Analysis VMs
- Flare VM: FireEye's Windows analysis VM (free, pre-configured tools)
- REMnux: Linux distribution for reverse engineering malware
- REM Workstation: Lenny Zeltser's analysis VM
- SIFT Workstation: SANS forensic analysis VM
VM Best Practices
- Snapshots: Create clean snapshot before each analysis
- Host-Only Networking: Disable internet access during analysis
- Guest Additions: Disable clipboard and drag-and-drop sharing
- VM Cloaking: Remove VM artifacts to avoid detection
- Dedicated Analysis Network: Use separate VLAN for detonation
🔧 Dynamic Analysis Tools
Windows System Monitoring Tools
| Tool | Purpose | Platform | Key Features |
|---|---|---|---|
| Process Monitor (ProcMon) | File system, registry, process monitoring | Windows | Real-time capture, filtering, boot logging, highlight events |
| Process Explorer | Process and DLL analysis | Windows | Process tree, handles, DLLs, performance graphs, virus total integration |
| API Monitor | API call monitoring | Windows | Capture API calls, parameters, return values, COM tracing |
| RegShot | Registry and file system comparison | Windows | Take snapshots before/after execution, generate diff reports |
| Autoruns | Persistence enumeration | Windows | List all auto-start locations, verify signatures, VT integration |
Network Monitoring Tools
| Tool | Purpose | Platform | Key Features |
|---|---|---|---|
| Wireshark | Network traffic capture and analysis | Cross-platform | Packet capture, protocol analysis, display filters, follow streams |
| tcpdump | Command-line packet capture | Linux/Unix | Lightweight, scriptable, remote capture |
| FakeNet-NG | Network service simulation | Windows/Linux | Simulates DNS, HTTP, HTTPS, SMTP, and other services |
| INetSim | Network service simulation | Linux | Simulates various network services, configurable responses |
| Burp Suite | HTTP/HTTPS proxy and analysis | Cross-platform | Intercept, modify, replay HTTP requests, repeater, intruder |
Automated Sandbox Solutions
| Sandbox | Type | Features | Best For |
|---|---|---|---|
| Cuckoo Sandbox | Open-source | Customizable, API integration, extensive reporting, plugin support | Advanced analysis, research, customization |
| CAPE Sandbox | Open-source | Cuckoo fork, malware unpacking, configuration extraction | Packed malware analysis, configuration extraction |
| Joe Sandbox | Commercial | Deep analysis, malware classification, behavior profiles | Professional investigations, enterprise IR |
| VMRay Analyzer | Commercial | Hypervisor-based, anti-evasion, timeline view | Enterprise incident response, malware detection |
| Intezer Analyze | Cloud/SaaS | Code similarity, malware genealogy, automated analysis | Threat intelligence, malware classification |
| Hybrid Analysis | Cloud (free tier) | Public sandbox, Falcon integration, community sharing | Quick triage, community threat intelligence |
| ANY.RUN | Cloud (freemium) | Interactive analysis, real-time monitoring, live interaction | Interactive malware analysis, education |
Cuckoo Sandbox Commands
# Installation (Ubuntu)
sudo apt-get install cuckoo

# Start Cuckoo services
cuckoo -d
cuckoo web

# Submit a file for analysis
cuckoo submit /path/to/malware.exe

# Submit with custom options
cuckoo submit --timeout 120 --package exe malware.exe

# View analysis results via API
curl http://localhost:8090/tasks/view/1

# List all tasks
cuckoo list

# Submit via API
curl -F "file=@malware.exe" http://localhost:8090/tasks/create/file

# Submit via API with options
curl -F "file=@malware.exe" -F "timeout=120" http://localhost:8090/tasks/create/file

# CAPE Sandbox (Cuckoo fork)
cape submit malware.exe
cape web
FakeNet-NG Commands
# Start FakeNet-NG (Windows)
FakeNet-NG.exe

# Start with specific configuration
FakeNet-NG.exe -c C:\FakeNet-NG\fakenet.conf

# Start with logging
FakeNet-NG.exe -l C:\Logs\fakenet.log

# Start FakeNet-NG (Linux)
sudo python fakenet.py

# View captured requests
# Logs are saved in C:\FakeNet-NG\Logs\ (Windows)
# /var/log/fakenet/ (Linux)
📋 Dynamic Analysis Checklist
Before Execution (Preparation)
- ✓ Revert VM to clean snapshot
- ✓ Verify network isolation (no internet access)
- ✓ Start INetSim/FakeNet-NG (if using)
- ✓ Start Process Monitor (enable boot logging if needed)
- ✓ Start Process Explorer
- ✓ Start Wireshark/tcpdump for network capture
- ✓ Take RegShot baseline snapshot
- ✓ Record system time (UTC recommended)
- ✓ Document VM configuration
- ✓ Disable Windows Defender/AV temporarily
- ✓ Ensure analysis tools are running and logging
During Execution
- ✓ Execute malware sample
- ✓ Observe initial behavior (30-60 seconds)
- ✓ Interact with malware if needed (click buttons, enter test data)
- ✓ Allow sufficient runtime (2-5 minutes typically)
- ✓ Monitor for process injection, new processes, network connections
- ✓ Take notes on observed behaviors in real-time
After Execution (Data Collection)
- ✓ Stop all monitoring tools
- ✓ Save ProcMon logs (PML format)
- ✓ Save Process Explorer snapshot
- ✓ Save Wireshark PCAP file
- ✓ Take second RegShot snapshot
- ✓ Generate RegShot diff report
- ✓ Extract dropped files from file system
- ✓ Document all observed behaviors
- ✓ Extract IOCs (IPs, domains, hashes, file paths)
- ✓ Revert VM to clean snapshot
🎯 Dynamic Analysis: What to Observe
| Category | What to Observe | Malware Indication | Tool to Use |
|---|---|---|---|
| Processes | New processes created, process injection, hollowing | Malware execution, defense evasion, lateral movement | ProcMon, Process Explorer, API Monitor |
| Files | Files created/modified/deleted, dropped executables, temp files | Installation, payload extraction, data theft, ransomware encryption | ProcMon, RegShot, FileMon |
| Registry | New keys/values, Run keys, services, browser settings | Persistence, configuration, browser hijacking, privilege escalation | ProcMon, RegShot, Autoruns |
| Network | Outbound connections, DNS queries, HTTP requests, C2 beacons | C2 communication, data exfiltration, malware updates, DDoS | Wireshark, tcpdump, FakeNet, INetSim |
| API Calls | Suspicious API sequences, anti-debugging checks | Malicious behavior, evasion techniques, privilege escalation | API Monitor, ProcMon |
| Services | New services installed, service modifications, service starts | Persistence, privilege escalation, malware service installation | Autoruns, sc query, Services.msc |
| Scheduled Tasks | New tasks created, task modifications, task triggers | Persistence, execution triggers, ransomware execution | Autoruns, schtasks, Task Scheduler |
| Memory | Process memory modifications, code injection, API hooks | Code injection, process hollowing, rootkit activity | Process Explorer, Volatility (post-analysis) |
⚠️ Malware Evasion Techniques in Sandboxes
| Technique | Description | Detection Method | Bypass Strategy |
|---|---|---|---|
| VM Detection | Checks for VM artifacts (MAC addresses, drivers, processes, registry) | Check for VMware/VirtualBox registry keys, MAC address OUI | Patch VM detection checks, use VM cloaking tools |
| Debugger Detection | Checks for debugger presence (IsDebuggerPresent, NtGlobalFlag) | API monitoring, hardware breakpoint detection | Hide debugger, patch checks, use kernel debugger |
| Timing Attacks | Detects execution slowdown caused by debugging or sandbox | RDTSC instruction, sleep checking, GetTickCount | Patch timing checks, use hardware breakpoints, emulate timers |
| Environment Checks | јунуChecks for sandbox-specific files, processes, or configurationsCheck for analysis tools (ProcMon, Wireshark), default usernames | Rename analysis tools, customize VM environment | |
| User Activity Detection | Detects lack of user interaction (mouse movements, keystrokes) | Check mouse position changes, keyboard input, window focus | Use automated mouse/keyboard simulators |
| Sleep Bypasses | |||
| Look for long-duration sleep calls (Sleep, WaitForSingleObject) | јунуPatch sleep calls, use faster analysis timeouts
- Use multiple sandbox solutions (different detection methods)
- Employ manual analysis for samples that detect automated sandboxes
- Use hypervisor-based analysis (VMRay, custom QEMU)
- Modify VM artifacts to avoid detection (MAC addresses, registry keys)
- Use automated interaction to simulate user activity
📊 Extracting Indicators of Compromise (IOCs)
Network IOCs
# Extract domains and IPs from PCAP
tshark -r capture.pcap -T fields -e dns.qry.name | sort -u > domains.txt
tshark -r capture.pcap -T fields -e ip.dst | sort -u > ips.txt

# Extract HTTP requests
tshark -r capture.pcap -Y "http.request" -T fields -e http.host -e http.request.uri

# Extract from FakeNet logs
cat /var/log/fakenet/fakenet.log | grep "DNS request" | awk '{print $NF}' > domains.txt
File System IOCs
# Extract file paths from ProcMon logs
# Export ProcMon logs to CSV, then extract paths

# From RegShot diff
grep "File added" regshot_diff.txt | awk '{print $NF}' > file_paths.txt

# Calculate hashes of dropped files
md5sum dropped_file.exe
sha256sum dropped_file.exe
Registry IOCs
# Extract registry changes from RegShot
grep "Registry value added" regshot_diff.txt > registry_changes.txt
grep "Run" registry_changes.txt  # Check for persistence
grep "Services" registry_changes.txt # Check for service installationDynamic malware analysis should only be performed on samples you have legal authority to analyze. Never execute malware on production systems or networks you do not own. Always use isolated, dedicated analysis environments.
31.4 Code Reversal Fundamentals
🔧 Reverse Engineering Fundamentals
Code reversal (reverse engineering) is the process of analyzing compiled binaries to understand their functionality, identify vulnerabilities, or extract algorithms. It requires knowledge of assembly language, processor architecture, and debugging techniques.
📊 Assembly Language Basics (x86/x64)
🔹 Common x86 Instructions
| Instruction | Purpose |
|---|---|
| MOV | Move data |
| PUSH/POP | Stack operations |
| CALL/RET | Function call/return |
| JMP | Unconditional jump |
| JE/JZ, JNE/JNZ | Conditional jumps |
| CMP | Compare values |
| ADD/SUB | Arithmetic operations |
| XOR/AND/OR | Bitwise operations |
🔹 Common x86 Registers
| Register | Purpose |
|---|---|
| EAX | Return value |
| EBX | Base pointer |
| ECX | Counter (loops) |
| EDX | I/O pointer |
| ESI/EDI | Source/destination index |
| EBP | Stack frame base |
| ESP | Stack pointer |
| EIP | Instruction pointer |
🛠️ Reverse Engineering Tools
| Tool | Type | Features | Price |
|---|---|---|---|
| IDA Pro | Disassembler/Debugger | Interactive, cross-references, decompiler, plugin support | $$$ |
| Ghidra | Disassembler/Decompiler | Free, NSA-developed, scriptable, collaborative | Free |
| x64dbg | Debugger | Windows user-mode debugger, plugin support | Free |
| OllyDbg | Debugger | Legacy Windows debugger, plugin ecosystem | Free |
| Binary Ninja | Disassembler | Modern UI, linear sweep, scripting | $$ |
| Radare2 | Disassembler/Debugger | Command-line, scriptable, cross-platform | Free |
🔧 Basic Reverse Engineering Workflow
# Step 1: Identify entry point
# In IDA Pro/Ghidra, locate entry function (start, main, WinMain)

# Step 2: Analyze imports
# Identify API calls that reveal functionality

# Step 3: Follow control flow
# Trace execution paths, identify key functions

# Step 4: Rename functions and variables
# Give meaningful names to discovered functions

# Step 5: Document findings
# Add comments explaining complex logic

# Step 6: Extract indicators
# IP addresses, domains, registry keys, file paths

# Step 7: Create signatures
# YARA rules, Snort signatures, IOCs
🎯 Common Anti-Reversing Techniques
| Technique | Description | Detection/Bypass |
|---|---|---|
| Anti-Debugging | Checks for debugger presence (IsDebuggerPresent, NtGlobalFlag) | Hide debugger, patch checks, use kernel debugger |
| Packing | Compressed/encrypted executable sections | Unpack using automated tools or manual unpacking |
| Obfuscation | Junk code, opaque predicates, control flow flattening | Dynamic analysis, deobfuscation scripts |
| Timing Attacks | Detects execution slowdown caused by debugging | Patch timing checks, use hardware breakpoints |
| Environment Checks | VM detection, sandbox detection, user activity checks | Modify environment, use different analysis platforms |
| Anti-Disassembly | Misleading disassembly (jump into middle of instruction) | Use emulation or advanced disassemblers |
31.5 Persistence Mechanisms Analysis
🔄 Understanding Malware Persistence
Persistence mechanisms allow malware to survive system reboots and maintain access to compromised systems. Analyzing persistence is critical for complete malware removal and understanding attacker intent.
📋 Windows Persistence Mechanisms
🔹 Registry Run Keys
# Common Run key locations
HKCU\Software\Microsoft\Windows\CurrentVersion\Run
HKLM\SOFTWARE\Microsoft\Windows\CurrentVersion\Run
HKCU\Software\Microsoft\Windows\CurrentVersion\RunOnce
HKLM\SOFTWARE\Microsoft\Windows\CurrentVersion\RunOnce
HKLM\SOFTWARE\WOW6432Node\Microsoft\Windows\CurrentVersion\Run

# Forensic detection
vol -f memory.dump windows.registry.printkey --key "Microsoft\Windows\CurrentVersion\Run"🔹 Windows Services
# Create service
sc create MalwareService binPath= "C:\malware.exe" start= auto

# Forensic detection
vol -f memory.dump windows.modules
sc query
Get-Service | Where-Object {$_.StartType -eq "Auto"}🔹 Scheduled Tasks
# Create scheduled task
schtasks /create /tn "MalwareTask" /tr "C:\malware.exe" /sc daily /st 09:00

# Forensic detection
schtasks /query /fo LIST /v
Get-ScheduledTask | Where-Object {$_.TaskPath -notlike "*Microsoft*"}🔹 Startup Folder
# Startup folder locations
C:\ProgramData\Microsoft\Windows\Start Menu\Programs\StartUp
C:\Users\[Username]\AppData\Roaming\Microsoft\Windows\Start Menu\Programs\Startup

# Forensic detection
# Examine folder contents for suspicious shortcuts🔹 Boot Execute (BootExecute)
# Registry key
HKLM\SYSTEM\CurrentControlSet\Control\Session Manager
Value: BootExecute

# Forensic detection
Registry Explorer → SYSTEM\CurrentControlSet\Control\Session Manager🔹 Winlogon Notifications
# Registry key
HKLM\SOFTWARE\Microsoft\Windows NT\CurrentVersion\Winlogon
Values: Userinit, Shell, Notify

# Forensic detection
Registry analysis, Autoruns📋 Linux Persistence Mechanisms
🔹 Cron Jobs
# User crontab
crontab -l
crontab -e

# System crontabs
/etc/crontab
/etc/cron.d/*
/etc/cron.hourly/*
/etc/cron.daily/*

# Forensic detection
cat /etc/crontab
ls -la /etc/cron.*/🔹 Systemd Services
# Service files location
/etc/systemd/system/
/usr/lib/systemd/system/

# Enable service
systemctl enable malicious.service

# Forensic detection
systemctl list-unit-files --type=service
find /etc/systemd/system/ -name "*.service" -exec ls -la {} \;🔹 Init.d Scripts
# Init scripts location
/etc/init.d/
/etc/rc*.d/

# Forensic detection
ls -la /etc/init.d/
ls -la /etc/rc*.d/ | grep -v "K\|S"🔹 .bashrc / .profile
# User shell configuration
~/.bashrc
~/.bash_profile
~/.profile
/etc/profile

# Forensic detection
cat ~/.bashrc
cat /etc/profile
grep -r "malware" /home/*/.bashrc🛠️ Persistence Detection Tools
| Tool | Platform | Features |
|---|---|---|
| Autoruns | Windows | Comprehensive persistence enumeration (Registry, services, tasks, drivers) |
| Sysinternals Suite | Windows | Process Monitor, Process Explorer, Autoruns |
| Volatility | Cross-platform | Memory forensics for persistence detection (modscan, driverscan) |
| Chkrootkit | Linux | Rootkit and persistence detection |
| Rkhunter | Linux | Rootkit hunter, backdoor detection |
| Lynis | Linux | Security auditing, persistence detection |
🎯 Persistence Analysis Workflow
# Step 1: Capture baseline (clean system)
# Run Autoruns and export configuration

# Step 2: Execute malware

# Step 3: Capture post-execution state
# Run Autoruns again and compare with baseline

# Step 4: Identify new entries
# Focus on:
# - Run keys with suspicious paths
# - New services with random names
# - Scheduled tasks with unusual triggers
# - Startup folder entries

# Step 5: Analyze each persistence entry
# - Check file location (is it in Temp, AppData, ProgramData?)
# - Check file hash against VirusTotal
# - Extract command line arguments
# - Check file digital signature

# Step 6: Document findings
# - Registry path
# - Command line
# - File path and hash
# - Detection methodMalware analysis should only be performed on samples obtained legally (from your own systems, with permission, or from authorized sources like VirusTotal). Never reverse engineer malware without proper authorization.
Anti-Forensics & Countermeasures
Anti-Forensics refers to techniques and methods used to obstruct, impede, or mislead digital forensic investigations. Understanding anti-forensics is crucial for forensic investigators to recognize when evidence has been tampered with, recover obscured data, and present findings that withstand legal scrutiny. This module covers common anti-forensic techniques and effective countermeasures.
The presence of anti-forensic artifacts is itself evidence of malicious intent and evidence tampering.
32.1 Data Wiping and Overwriting Techniques
🗑️ Understanding Data Wiping
Data wiping (also called secure deletion or data sanitization) is the process of intentionally overwriting data to prevent forensic recovery. Attackers use wiping to destroy evidence of their activities, while organizations use it for proper data disposal. Understanding wiping techniques helps forensic investigators recognize when data has been intentionally destroyed.
🔬 How Data Wiping Works
🔹 Simple Deletion vs Secure Wiping
| Method | What Happens | Recoverable? |
|---|---|---|
| Simple Delete | Removes file system reference only | Yes (until overwritten) |
| Empty Recycle Bin | Marks space as available | Yes (until overwritten) |
| Quick Format | Rewrites file system structures | Yes (with advanced tools) |
| Full Format | Writes zeros to entire disk | No (with modern tools) | Secure Wipe | Multiple overwrite passes | No |
🔹 Common Wiping Patterns
- Single Pass (Zero): Overwrites with zeros (fast, less secure)
- Single Pass (Random): Overwrites with random data
- Gutmann Method (35 passes): Multiple complex patterns (obsolete for modern drives)
- DoD 5220.22-M (3 passes): Zero → One → Random
- US Army AR380-19 (3 passes): Random → Complement → Random
- Peter Gutmann (35 passes): Designed for older MFM/RLL drives
- Secure Erase (ATA): Built-in drive command (SSD optimized)
🛠️ Common Data Wiping Tools
| Tool | Platform | Method | Forensic Detection |
|---|---|---|---|
| CCleaner (Drive Wiper) | Windows | Multiple passes (1-35) | Check for overwritten slack space |
| DBAN (Darik's Boot and Nuke) | Bootable | DoD 5220.22-M, Gutmann, Random | Boot sector modifications, wiped partition signatures |
| Eraser | Windows | Multiple standards | Check USN journal for delete events |
| SDelete (Sysinternals) | Windows | Single pass (random) | Process Monitor logs, prefetch artifacts |
| shred (Linux) | Linux | Multiple passes (default 3) | Check shell history, logs |
| wipe (Linux) | Linux | Gutmann method | Check system logs, bash history |
| HDDErase | Bootable | ATA Secure Erase | Check SMART logs, drive statistics |
🔬 SSD Wiping Challenges
- TRIM Command: SSDs automatically clear deleted data, making recovery difficult
- Wear Leveling: Overwrites may not affect all physical locations due to wear leveling algorithms
- Over-provisioning: Hidden storage area not accessible to the OS
- Garbage Collection: SSDs actively erase stale data in background
- Secure Erase is Recommended: ATA Secure Erase command is the most reliable for SSDs
🔍 Detecting Data Wiping Activities
🔹 Forensic Indicators of Wiping
- USN Journal: Records file deletion events with timestamps
- Prefetch Files: Execution evidence of wiping tools
- ShellBags: Folder navigation history
- RecentDocs: Recently accessed files (may show wiped files)
- Jump Lists: Recently opened files (Windows 7+)
- Event Logs: System events related to disk activity
- Amcache.hve: Program execution history
- SRUM (System Resource Usage Monitor): Application execution times
🔹 Recovery After Wiping
- Unallocated Space Carving: May recover fragments if not fully overwritten
- Slack Space Analysis: Previous data may remain in slack space
- Pagefile.sys Analysis: Memory pages may contain wiped data
- Hiberfil.sys Analysis: Hibernation file may contain memory snapshots
- Volume Shadow Copies: Previous versions may survive wiping
- Thumbcache.db: Thumbnails of wiped images may remain
📋 Countermeasures Against Data Wiping
- Image immediately: Acquire forensic image before any potential wiping completes
- Preserve volatile data: Capture RAM before shutdown (wiping tools may be in memory)
- Analyze USN Journal: Critical for establishing deletion timeline
- Check Volume Shadow Copies: May contain pre-wiped data
- Examine application logs: Wiping tools often leave traces in logs
- Document evidence of wiping: Presence of wiping tools is itself evidence
32.2 Encryption and Steganography as Anti-Forensics
🔐 Encryption & Steganography in Anti-Forensics
Encryption and steganography are powerful anti-forensic techniques that prevent investigators from accessing or even discovering hidden data. Understanding these methods helps forensic examiners recognize their use and develop strategies to overcome them.
🔒 Encryption as Anti-Forensics
🔹 Types of Encryption Used by Attackers
- Full Disk Encryption (FDE): BitLocker, FileVault, LUKS, VeraCrypt
- File/Folder Encryption: EFS, VeraCrypt containers, 7-Zip encrypted archives
- Email Encryption: PGP, S/MIME
- Communication Encryption: TLS/SSL, Signal Protocol, WhatsApp encryption
- Ransomware Encryption: Used to hold data hostage
- VPN/Tor: Hide network traffic and IP addresses
🔹 Forensic Impact of Encryption
- Inaccessible Data: Without decryption key, encrypted data is unreadable
- Key Recovery Challenges: Keys may be stored in memory, TPM, or external devices
- Legal Hurdles: Compelling password disclosure requires legal process
- Cloud Encryption: Data may be encrypted before upload
- Deadline Pressure: Some encryption methods have automatic deletion after failed attempts
🎨 Steganography as Anti-Forensics
🔹 Steganography Techniques
- Image Steganography: LSB substitution, DCT coefficients (JPEG), palette modification (GIF)
- Audio Steganography: LSB in audio samples, echo hiding, phase coding
- Video Steganography: Hidden data in video frames
- Network Steganography: Hidden data in TCP/IP headers, timing channels
- File System Steganography: Alternate Data Streams (ADS), slack space
- Text Steganography: Whitespace manipulation, character encoding
🔹 Popular Steganography Tools
- Steghide: Hides data in JPEG, BMP, WAV, AU files
- OpenStego: Java-based steganography tool
- DeepSound: Audio steganography for WAV/FLAC
- Snow: Hides data in whitespace of text files
- ImageHide: Hides files in images
- Xiao Steganography: BMP/PNG steganography
🔍 Detecting Encryption and Steganography
| Technique | Detection Method | Forensic Tools |
|---|---|---|
| Full Disk Encryption | Check for BitLocker/VeraCrypt indicators, boot screen, partition signatures | FTK Imager, Arsenal Image Mounter |
| Encrypted Archives | File headers indicate encryption (e.g., ZIP with encryption flag) | 7-Zip, WinRAR, Zip2John |
| Image Steganography | Statistical analysis, LSB anomalies, file size anomalies | StegDetect, StegExpose, StegSpy, Zsteg |
| Audio Steganography | Spectral analysis, LSB analysis, statistical anomalies | Audacity (spectral view), Sonic Visualiser |
| Network Covert Channels | Traffic analysis, timing analysis, packet inspection | Wireshark, tcpdump, Snort |
| Alternate Data Streams | Directory listing with /r flag, forensic tools | Dir /r, PowerShell, FTK Imager |
⚖️ Legal Considerations for Encryption
- Password Compulsion Laws: Some jurisdictions require suspects to decrypt data (e.g., UK Regulation of Investigatory Powers Act)
- Fifth Amendment (US): Courts have ruled that compelling passwords may violate self-incrimination protections
- Key Recovery via Memory: RAM may contain decryption keys (volatile data capture)
- TPM/BitLocker Recovery: Recovery keys may be stored in Microsoft account or AD
- Warrant for Cloud Data: Cloud providers may have access to decrypted data
📋 Countermeasures Against Encryption & Steganography
- Capture memory before shutdown: Encryption keys may be in RAM
- Use live forensics: Access encrypted data while system is running
- Image the system while running: Capture decrypted state
- Search for encryption tools: Installation of encryption software is evidence
- Analyze memory dumps: Keys and decrypted data may be recoverable
- Use steganalysis tools: Statistical detection of hidden data
- Examine file entropy: High entropy indicates encryption or compression
32.3 Log Tampering and Deletion
📜 Log Manipulation as Anti-Forensics
Attackers frequently tamper with or delete logs to cover their tracks and evade detection. Understanding log tampering techniques helps investigators identify when logs have been manipulated and recover deleted log data.
🔧 Common Log Tampering Techniques
🔹 Windows Event Log Tampering
- Event ID 1102: Audit log cleared (major red flag)
- wevtutil cl: Command to clear logs
- PowerShell Clear-EventLog: PowerShell log clearing
- Event ID 104: System log cleared
- Selective Deletion: Tools to delete specific events
- Registry modifications: Disable logging or change log size
🔹 Linux Log Tampering
- rm /var/log/*: Delete all logs
- cat /dev/null > /var/log/auth.log: Clear log file
- history -c: Clear bash history
- rm ~/.bash_history: Delete command history
- unset HISTFILE: Disable history recording
- Logrotate manipulation: Force log rotation/deletion
🔹 Web Server Log Tampering
- Direct log file editing: Remove specific entries
- Log injection: Add fake entries to mislead
- Log rotation exploitation: Force premature rotation
- Symlink attacks: Redirect logging to /dev/null
🔹 Application Log Tampering
- Database log manipulation: Delete or modify transaction logs
- Application-level log clearing: Many apps have log management features
- API log tampering: Direct access to log storage
🔍 Detecting Log Tampering
| Indicator | What to Look For | Detection Method |
|---|---|---|
| Log Gaps | Missing expected events, timestamp jumps | Timeline analysis, event ID sequence checking |
| Log Clearing Events | Event ID 1102 (Windows), logrotate deletions (Linux) | Event log analysis, log rotation logs |
| File System Artifacts | Deleted log files in unallocated space, USN journal entries | Carving, USN journal analysis, MFT analysis |
| Service Restarts | Logging service restarts around incident time | Service control manager logs, system logs |
| Registry Changes | Modifications to logging settings | Registry analysis (EventLog keys) | File Hashes | Current log hash vs expected (if baseline exists) | Hash comparison |
🔧 Recovering Deleted Logs
🔹 Windows Log Recovery
- Volume Shadow Copies: Previous versions of .evtx files
- Unallocated Space Carving: Recover deleted EVTX fragments
- Windows.edb (Windows Search): May contain indexed log data
- Event log backup files: .evtx files in backup locations
🔹 Linux Log Recovery
- Deleted file recovery: Using extundelete, foremost, scalpel
- Logrotate backups: .gz, .1, .2.gz files in /var/log/
- Systemd journal: journalctl --vacuum-size option leaves traces
- Shell history recovery: .bash_history may have backups
📋 Countermeasures Against Log Tampering
- Enable central logging: Send logs to remote syslog/SIEM (attacker cannot delete both)
- Use write-once media: Store logs on write-protected storage
- Implement log signing: Cryptographic signatures prevent undetected modification
- Regular log backups: Maintain off-system backups
- Monitor for log clearing: Alert on Event ID 1102 (Windows) or log deletion
- Use integrity monitoring: File integrity monitoring for log files
- Analyze log gaps: Any gap in expected log entries is suspicious
32.4 Timestamp Manipulation
⏱️ Timestamp Manipulation as Anti-Forensics
Timestamp manipulation (timestomping) is the deliberate alteration of file timestamps to mislead investigators, hide activity timelines, or frame innocent parties. Understanding timestamp manipulation helps forensic examiners detect inconsistencies and reconstruct accurate timelines.
🔧 Timestamp Manipulation Techniques
🔹 Windows Timestamp Manipulation
- PowerShell: (Get-Item file.txt).CreationTime = "2020-01-01"
- SetFileTime (NirSoft): GUI tool to modify all timestamps
- Attribute Changer: GUI file attribute/timestamp tool
- Timestamp (Sysinternals): timestamp.exe -c "01/01/2020" file.txt
- NTFS $STANDARD_INFORMATION vs $FILE_NAME: Attackers may modify one but not the other
🔹 Linux Timestamp Manipulation
- touch: touch -t 202001011200 file.txt (change all timestamps)
- touch -a: Change access time only
- touch -m: Change modification time only
- debugfs: Direct inode manipulation (advanced)
- timestomp: Metasploit timestamp manipulation tool
🔹 NTFS Dual Timestamp System
- $STANDARD_INFORMATION (SI): User-accessible, easy to modify
- $FILE_NAME (FN): System-maintained, harder to modify
- Forensic Significance: Mismatch between SI and FN timestamps indicates manipulation
🔹 Timestamp Consistency Checks
- Modified < Created: Impossible unless timestamp manipulated
- Future timestamps: Dates in the future are suspicious
- Logical inconsistencies: Access before creation, modification before creation
- Batch patterns: Multiple files with identical timestamps
🔍 Detecting Timestamp Manipulation
| Indicator | What to Look For | Detection Tool |
|---|---|---|
| SI/FN Mismatch | $STANDARD_INFORMATION and $FILE_NAME timestamps differ | Registry Explorer, FTK, EnCase, X-Ways |
| Logical Inconsistencies | Modified time < Creation time, Access time < Creation time | Timeline analysis tools |
| Batch Patterns | Many files with identical timestamps | File system analysis tools |
🔧 Tools for Timestamp Analysis
# Windows: Compare SI and FN timestamps using MFTEcmd
MFTECmd.exe -f \$MFT --csv output

# Linux: Check inode timestamps
stat file.txt
debugfs -R 'stat ' /dev/sda1

# Detect timestamp manipulation with Volatility
vol -f memory.dump windows.mftscan

# Check for timestamp inconsistencies across files
find / -type f -newerBt "2024-01-01" ! -newerBt "2024-01-02" 2>/dev/null
📋 Countermeasures Against Timestamp Manipulation
- Analyze both SI and FN timestamps: Mismatches indicate manipulation
- Correlate with other artifacts: Event logs, prefetch, USN journal
- Establish timelines from multiple sources: Don't rely on single timestamp
- Use file system journaling: $LogFile (NTFS) and journal (ext3/4) record changes
- Check volume shadow copies: Previous versions may show original timestamps
- Document inconsistencies: Timestamp manipulation is evidence of tampering
32.5 Detecting Anti-Forensic Activities
🕵️ Detecting Anti-Forensics
Detecting anti-forensic activities requires a multi-layered approach combining artifact analysis, consistency checking, timeline reconstruction, and anomaly detection. The presence of anti-forensic artifacts is itself evidence of malicious intent.
📊 Comprehensive Detection Framework
| Anti-Forensic Technique | Detection Method | Key Artifacts to Examine |
|---|---|---|
| Data Wiping | USN Journal analysis, file system metadata, unallocated space carving | USN Journal ($J), MFT records, $LogFile, prefetch files |
| Encryption | Entropy analysis, partition signatures, registry artifacts | High entropy files, BitLocker/VeraCrypt signatures, encryption software artifacts |
| Steganography | Statistical analysis, LSB anomalies, file signature mismatches | Image histograms, color frequency, file size anomalies |
| Log Tampering | Event ID 1102 analysis, log gaps, file system timestamps | Security.evtx, System.evtx, log rotation logs |
| Timestamp Manipulation | SI/FN comparison, timeline consistency, cross-artifact correlation | MFT records, $STANDARD_INFORMATION, $FILE_NAME, event logs |
| Process Hiding | Cross-view detection, DKOM detection, memory scanning | EPROCESS structures, DKOM anomalies, hidden threads |
| Anti-Forensic Tools | Prefetch analysis, Amcache, Shimcache, execution artifacts | Prefetch files, Amcache.hve, Shimcache, UserAssist, SRUM |
🔍 Detection Techniques by Category
1. File System Analysis
- USN Journal Analysis: Review $J file for file creation/deletion/rename events
- MFT Record Analysis: Examine $STANDARD_INFORMATION vs $FILE_NAME timestamps
- $LogFile Analysis: Transaction logs reveal file system changes
- Slack Space Analysis: Previous data may remain in slack space
- Unallocated Space Carving: Recover deleted files and fragments
2. Registry Analysis
- Run Keys: Check for persistence mechanisms
- UserAssist: Program execution history
- RecentDocs: Recently accessed files
- ShellBags: Folder navigation history
- Amcache.hve: Program execution and file metadata
- Shimcache: Program execution history (even if deleted)
3. Memory Analysis
- Process List Cross-View: Compare pslist vs psscan vs psxview
- DKOM Detection: Identify unlinked EPROCESS structures
- Code Injection Detection: Malfind plugin for injected code
- Hidden DLL Detection: LDREnum plugin
- Rootkit Detection: Callbacks, SSDT hooks, IDT hooks
4. Log Analysis
- Event ID 1102: Audit log cleared (Windows)
- Event ID 104: System log cleared
- Log Gaps: Missing expected events
- Service Restarts: Logging service restarts
- PowerShell Logs: Script block logging (Event ID 4104)
🛠️ Anti-Forensic Detection Tools
| Tool | Purpose | Platform |
|---|---|---|
| Volatility | Memory forensics, hidden process detection, rootkit detection | Cross-platform | Autoruns | Persistence mechanism detection | Windows |
| Process Monitor | Real-time file system, registry, process monitoring | Windows | RegRipper / Registry Explorer | Registry analysis, timestamp comparison | Windows |
| MFTECmd | MFT analysis, SI/FN timestamp comparison | Windows |
| EvtxeCmd | Event log analysis, log clearing detection | Windows |
| StegDetect / StegExpose | Steganography detection | Linux/Windows |
| Binwalk | Embedded file detection, entropy analysis | Cross-platform |
📋 Forensic Workflow for Detecting Anti-Forensics
Acquire
Forensic ImageAnalyze
File SystemCheck
RegistryExamine
Event LogsAnalyze
MemoryCorrelate
FindingsDetecting anti-forensic activities requires specialized tools and expertise. Always document findings thoroughly, maintain chain of custody, and be prepared to explain detection methodologies in court.
Linux Forensics
Linux Forensics is the specialized discipline of performing forensic investigations on Linux-based systems. Linux is an open-source operating system widely used across servers, cloud infrastructure, IoT devices, and desktops. With the increase in cybercrime targeting Linux environments, it is essential for forensic investigators to be well-equipped with the knowledge of collecting artifacts from Linux machines in a forensically sound manner.
Linux forensics involves using various commands and tools to retrieve, examine, and analyze valuable artifacts pertaining to incidents of cybercrime involving Linux machines.
51.1 Introduction to Linux Forensics
🐧 What is Linux Forensics?
Linux forensics refers to performing forensic investigations on a Linux-based device. Investigators require an understanding of tools and techniques necessary to collect volatile and non-volatile data, conduct live analysis, and possess good knowledge of various shell commands that can be used on Linux machines to retrieve forensically valuable information.
📊 Why Linux Forensics Matters
Server Dominance
Over 70% of web servers run LinuxCloud Infrastructure
AWS, Azure, GCP predominantly Linux-basedIoT/Embedded
Android, routers, smart devices🔑 Key Linux Forensic Concepts
| Concept | Description | Forensic Relevance |
|---|---|---|
| Everything is a File | In Linux, hardware, processes, and devices are represented as files | Unified approach to evidence collection |
| Open Source | Source code available for inspection | Tool validation and understanding of system behavior |
| Command Line Interface | Powerful CLI for system administration | Ability to script and automate evidence collection |
| Permission System | rwx permissions and ownership | Understanding access controls and user activity |
51.2 Collecting Volatile Data
⚡ Understanding Volatile Data
Volatile data is lost when a machine is turned off or powered down. During forensic investigation, investigators need to collect this data to construct timeline analysis of the incident that occurred. Volatile data should be collected FIRST, before any other forensic activities.
📋 Volatile Data Collection Checklist
| Artifact | Command | Forensic Value |
|---|---|---|
| Hostname | hostname |
Identify the system name |
| Date & Time | date, cat /etc/timezone, date +%s |
Establish timeline, timezone, EPOCH timestamp |
| System Uptime | uptime, cat /proc/uptime |
Determine when system was last rebooted |
| Current Users | w, who, users |
Identify logged-in users |
| Network Configuration | ip addr show, ifconfig -a |
IP addresses, MAC addresses, network interfaces |
| Network Connections | netstat -tulpn, ss -tulpn |
Open ports, associated processes, active connections |
| Routing Table | netstat -rn, ip route show |
Network paths, default gateway |
| ARP Cache | arp -a, ip neigh show |
MAC to IP mappings, network neighbors |
| Running Processes | ps auxww, ps -ef, top -b -n 1 |
Active processes, PIDs, CPU/memory usage, command lines |
| Open Files | lsof |
Files opened by processes |
| Loaded Kernel Modules | lsmod |
Detect kernel rootkits, malicious drivers |
| Disk Partitions | cat /proc/partitions, df -h |
Disk layout, mounted filesystems |
| ELF Binary Info | readelf -h /bin/ls |
Executable file format analysis |
🔧 Detailed Volatile Data Collection Commands
Hostname and System Information
# Get system hostname
hostname
hostname -f  # Fully qualified domain name

# Get system information
uname -a
cat /etc/os-release
Date, Time, and Timezone
# Current date and time
date
date -u  # UTC time
date +%s  # EPOCH timestamp (seconds since 1970-01-01)

# Timezone information
cat /etc/timezone
timedatectl status

# Hardware clock
hwclock --show
System Uptime
# System uptime
uptime
cat /proc/uptime

# Last system boot time
who -b
last reboot | head -5
User Information
# Currently logged-in users
w
who
users
who am i  # Current user

# Last logins
last
lastlog
Network Configuration
# Network interfaces and IP addresses
ip addr show
ifconfig -a

# MAC addresses
ip link show
cat /sys/class/net/*/address

# DNS configuration
cat /etc/resolv.conf
systemd-resolve --status

# Network statistics
netstat -i  # Interface statistics
netstat -s  # Protocol statistics
Open Ports and Connections
# TCP and UDP listening ports with process info
netstat -tulpn
ss -tulpn

# All active connections
netstat -an
ss -an

# To detect intrusions, collect open port information
# It is also important to check programs/processes associated with open ports
netstat -tulpn | grep LISTEN

# Using nmap for local port scanning
nmap -sT localhost  # TCP scan
nmap -sU localhost  # UDP scan
Running Processes
# Full process list with command line arguments
ps auxww
ps -ef

# Process tree
pstree -p

# Top processes by CPU/memory
top -b -n 1
htop  # if available

# Specific process details
ls -la /proc/[PID]/
cat /proc/[PID]/cmdline
cat /proc/[PID]/status
Open Files (lsof)
# All open files
lsof

# Files opened by specific process
lsof -p [PID]

# Network files (sockets)
lsof -i

# Files in a specific directory
lsof +D /var/log/
Kernel Modules and ELF Analysis
# Loaded kernel modules
lsmod
cat /proc/modules

# ELF (Executable and Linkable Format) binary analysis
readelf -h /bin/ls
readelf -l /bin/ls
file /bin/ls51.3 Collecting Non-Volatile Data
💾 Non-Volatile Data Collection
Non-volatile data persists after system shutdown and includes configuration files, logs, user data, and installed applications. This data is collected after volatile data and can be analyzed offline.
📋 Non-Volatile Data Collection Checklist
| Artifact | Command/Location | Forensic Value |
|---|---|---|
| System Information | cat /proc/cpuinfo, cat /proc/meminfo |
CPU, memory, hardware details |
| Kernel Information | uname -r, cat /proc/version |
Kernel version, build information |
| User Accounts | cat /etc/passwd, cat /etc/shadow, cat /etc/group |
Local user accounts, password hashes, group memberships |
| Sudoers Configuration | cat /etc/sudoers, cat /etc/sudoers.d/* |
Privilege escalation paths |
| Login History | last -f /var/log/wtmp, lastb -f /var/log/btmp |
Successful and failed login attempts |
| Command History | cat ~/.bash_history, cat ~/.zsh_history |
User command execution history |
| System Logs | /var/log/syslog, /var/log/auth.log, /var/log/kern.log |
System events, authentication, kernel messages |
| Installed Packages | dpkg -l (Debian), rpm -qa (RHEL) |
Software inventory |
| Cron Jobs | /etc/crontab, /etc/cron.d/*, user crontabs |
Scheduled tasks, persistence mechanisms |
| Startup Scripts | /etc/init.d/, /etc/systemd/system/, /etc/rc.local |
System startup programs, persistence |
| Hidden Files | ls -la /home/*/.*, find / -name ".*" -type f |
Concealed data, malware hiding |
| Network Configuration | /etc/network/interfaces, /etc/hosts, /etc/hostname |
Persistent network settings |
🔧 Detailed Non-Volatile Data Collection Commands
System and Hardware Information
# CPU information
cat /proc/cpuinfo
lscpu

# Memory information
cat /proc/meminfo
free -h
dmidecode -t memory

# Disk information
cat /proc/partitions
lsblk
fdisk -l

# Hardware information
lshw
lspci
lsusb
Kernel Information
# Kernel version
uname -r
uname -a

# Kernel build information
cat /proc/version
cat /proc/cmdline  # Boot parameters
User Accounts (cat /etc/passwd)
# User account file format
# root:x:0:0:root:/root:/bin/bash
# └─┬─┘└┬┘└┬┘└─┬─┘└─┬─┘└───┬───┘
# Username Password UID GID  Home  Shell
# 'x' indicates encrypted password in /etc/shadow

cat /etc/passwd
cat /etc/shadow  # Requires root
cat /etc/group
cat /etc/gshadow

# Last password changes
passwd -S [username]
Login History
# Successful logins
last -f /var/log/wtmp
lastlog

# Failed login attempts
lastb -f /var/log/btmp

# Current user sessions
who

# Login records (binary formats require 'last' command)
Command History
# Bash history for current user
cat ~/.bash_history
history

# Bash history for all users
find /home -name ".bash_history" -exec cat {} \;
cat /root/.bash_history

# Zsh history
cat ~/.zsh_history

# Other shells
cat ~/.history
cat ~/.sh_history
System Logs
# System logs
cat /var/log/syslog
cat /var/log/messages

# Authentication logs
cat /var/log/auth.log
cat /var/log/secure

# Kernel logs
cat /var/log/kern.log
dmesg

# Application logs
/var/log/apache2/
/var/log/nginx/
/var/log/mysql/
/var/log/postgresql/

# Package manager logs
cat /var/log/dpkg.log
cat /var/log/yum.log
Installed Packages
# Debian/Ubuntu
dpkg -l
apt list --installed

# RHEL/CentOS/Fedora
rpm -qa
yum list installed

# Arch Linux
pacman -Q

# Check for suspicious packages
dpkg -l | grep -i "hack\|exploit\|malware"
Cron Jobs and Scheduled Tasks
# System crontabs
cat /etc/crontab
ls -la /etc/cron.d/
ls -la /etc/cron.hourly/
ls -la /etc/cron.daily/
ls -la /etc/cron.weekly/
ls -la /etc/cron.monthly/

# User crontabs
crontab -l -u [username]
cat /var/spool/cron/crontabs/*

# Systemd timers
systemctl list-timers
Startup and Persistence
# System V init scripts
ls -la /etc/init.d/
ls -la /etc/rc*.d/

# Systemd services
systemctl list-unit-files --type=service
ls -la /etc/systemd/system/
ls -la /usr/lib/systemd/system/

# rc.local
cat /etc/rc.local
cat /etc/rc.d/rc.local

# Profile scripts
cat /etc/profile
ls -la /etc/profile.d/
cat ~/.bashrc
cat ~/.profile
Hidden Files and Directories
# List all files including hidden
ls -la
ls -laR /home/

# Find all hidden files
find / -name ".*" -type f 2>/dev/null

# Find hidden directories
find / -name ".*" -type d 2>/dev/null

# Check for suspicious hidden files
find / -name ".*" -type f -exec file {} \; | grep -i "executable\|script"51.4 Linux File System Analysis (EXT4)
📁 EXT4 File System Forensics
EXT4 (Fourth Extended File System) is the default file system for most Linux distributions. Understanding its structure is essential for recovering deleted files, analyzing metadata, and detecting hidden data.
🔬 EXT4 Key Forensic Artifacts
| Artifact | Location | Forensic Value |
|---|---|---|
| Superblock | Block 0 (offset 1024 bytes) | File system metadata, block size, inode count |
| Inode Table | Fixed location after superblock | File metadata (timestamps, permissions, size) |
| Journal ($J) | Reserved area in file system | Transaction logs, deleted file names |
| Directory Entries | Within inode data blocks | File names, inode mappings |
| Block Bitmap | Fixed location | Used/free block tracking |
| Inode Bitmap | Fixed location | Used/free inode tracking |
🛠️ EXT4 Forensic Analysis Commands
# File system information
dumpe2fs /dev/sda1
tune2fs -l /dev/sda1

# List deleted files (using The Sleuth Kit)
fls -r -d /dev/sda1

# Recover deleted file by inode
icat /dev/sda1 [inode_number] > recovered_file

# Create timeline
fls -r -m / -o 2048 image.dd > bodyfile.txt
mactime -b bodyfile.txt -d > timeline.csv

# Check superblock backups
dumpe2fs /dev/sda1 | grep -i "backup superblock"51.5 Log Analysis and Timeline Reconstruction
📜 Linux Log Analysis
Linux systems generate extensive logs that are critical for incident reconstruction. Understanding log locations and analysis techniques is essential for forensic investigations.
📋 Linux Log Locations
| Log File | Purpose | Key Events |
|---|---|---|
/var/log/syslog |
General system log | System messages, service status |
/var/log/auth.log |
Authentication log (Debian/Ubuntu) | Login attempts, sudo usage, SSH connections |
/var/log/secure |
Authentication log (RHEL/CentOS) | Login attempts, sudo usage, SSH connections |
/var/log/kern.log |
Kernel log | Driver issues, kernel messages, OOM events |
/var/log/boot.log |
Boot process log | Startup sequence, service initialization |
/var/log/dmesg |
Kernel ring buffer | Hardware detection, boot messages |
/var/log/apache2/access.log |
Web server access log | HTTP requests, IP addresses, accessed resources |
/var/log/apache2/error.log |
Web server error log | Server errors, attack attempts |
🔍 Log Analysis Commands
# Search for authentication failures
grep "Failed password" /var/log/auth.log
grep "authentication failure" /var/log/auth.log

# Search for successful logins
grep "Accepted" /var/log/auth.log

# Search for sudo usage
grep "sudo" /var/log/auth.log

# Search for SSH connections
grep "sshd" /var/log/auth.log

# Search by IP address
grep "192.168.1.100" /var/log/auth.log

# Search by user
grep "username" /var/log/auth.log

# Timeline search (specific date)
grep "Jan 15" /var/log/auth.log

# Use journalctl for systemd logs
journalctl -u sshd
journalctl --since "2024-01-15" --until "2024-01-16"
journalctl -k  # Kernel logs

# Combine logs for timeline
cat /var/log/auth.log /var/log/syslog | sort > timeline.txt51.6 Rootkit and Malware Detection
🦠 Detecting Malware on Linux
Linux systems are increasingly targeted by malware and rootkits. Investigators must use specialized tools to detect hidden processes, kernel modifications, and malicious files.
🛡️ Rootkit Detection Tools
# Install rkhunter
sudo apt install rkhunter -y

# Run system scan
sudo rkhunter --check

# Check for rootkits, show only warnings
sudo rkhunter --check --rwo

# Update definitions
sudo rkhunter --update

# Check specific properties
sudo rkhunter --propupd # Update file properties database# Install chkrootkit
sudo apt install chkrootkit -y
# Run system scan
sudo chkrootkit
# Check specific components
sudo chkrootkit -q # Quiet mode
# Check for specific rootkits
sudo chkrootkit -n # Skip NFS mounted directories# Install Lynis
sudo apt install lynis -y
# Run security audit
sudo lynis audit system
# Check for malware indicators
sudo lynis --tests-from-group malware# Install ClamAV
sudo apt install clamav clamav-daemon -y
# Update virus definitions
sudo freshclam
# Scan directory
sudo clamscan -r /home/
# Scan entire system with logging
sudo clamscan -r / --log=clamscan.log
# Detect suspicious files (ELF binaries)
sudo clamscan -r / --detect-pua=yes🔍 Manual Malware Detection Techniques
# Check for suspicious processes
ps auxww | grep -i -E "virus|malware|backdoor|trojan|keylog"
lsof -i
netstat -tulpn

# Check for suspicious files in temp directories
ls -la /tmp/
ls -la /var/tmp/
find /tmp -type f -executable

# Check for modified system binaries
find /bin /sbin /usr/bin /usr/sbin -type f -mtime -7

# Check for hidden processes
ps -ef | grep "^ "
pstree -p

# Check for LD_PRELOAD hacks
cat /etc/ld.so.preload
grep -r "LD_PRELOAD" /etc/profile /etc/bash.bashrc ~/.bashrc

# Check for kernel module rootkits
lsmod
cat /proc/modules
find /lib/modules -name "*.ko" -mtime -7

# Check for suspicious cron entries
cat /etc/crontab
for user in $(cut -f1 -d: /etc/passwd); do crontab -u $user -l; done51.7 Forensic Tools for Linux
🛠️ Essential Linux Forensic Tools
A variety of open-source and commercial tools are available for Linux forensics. This section covers the most essential tools for evidence acquisition, analysis, and reporting.
📦 Forensic Tools Reference
| Tool | Purpose | Installation | Key Features |
|---|---|---|---|
| The Sleuth Kit | File system forensics | sudo apt install sleuthkit |
MFT analysis, deleted file recovery, timeline |
| Autopsy | GUI forensic platform | sudo apt install autopsy |
Case management, timeline visualization |
| Volatility | Memory forensics | pip install volatility3 |
RAM analysis, process detection, malware hunting |
| Wireshark | Network forensics | sudo apt install wireshark |
Packet capture, protocol analysis |
| foremost | File carving | sudo apt install foremost |
Recover files by signature |
| scalpel | File carving | sudo apt install scalpel |
Configurable file carving |
| binwalk | Firmware analysis | sudo apt install binwalk |
Embedded file extraction |
| exiftool | Metadata analysis | sudo apt install exiftool |
EXIF, IPTC, XMP extraction |
🔧 Forensic Live CD Distributions
Kali Linux
Pre-installed forensic tools, penetration testingCAINE
Computer Aided INvestigative EnvironmentSIFT Workstation
SANS Investigative Forensic Toolkit51.8 Practical Lab Exercises
🧪 Hands-On Linux Forensics Labs
These practical exercises will help you apply Linux forensic techniques in real-world scenarios.
📋 Lab 1: Volatile Data Collection Script
#!/bin/bash
# Linux Volatile Data Collection Script
# Save as collect_volatile.sh

OUTPUT_DIR="/mnt/usb/case_001/volatile"
mkdir -p $OUTPUT_DIR

echo "=== Collecting Volatile Data ===" | tee $OUTPUT_DIR/collection.log
date | tee -a $OUTPUT_DIR/collection.log

# Hostname
hostname > $OUTPUT_DIR/hostname.txt

# System time and uptime
date > $OUTPUT_DIR/date.txt
uptime > $OUTPUT_DIR/uptime.txt

# Network configuration
ip addr show > $OUTPUT_DIR/ip_addr.txt
netstat -tulpn > $OUTPUT_DIR/netstat.txt
arp -a > $OUTPUT_DIR/arp.txt

# Running processes
ps auxww > $OUTPUT_DIR/ps.txt
pstree -p > $OUTPUT_DIR/pstree.txt

# Open files
lsof > $OUTPUT_DIR/lsof.txt

# Logged-in users
w > $OUTPUT_DIR/users.txt
last > $OUTPUT_DIR/last.txt

echo "Collection complete. Output saved to $OUTPUT_DIR"
📋 Lab 2: Non-Volatile Data Collection Script
#!/bin/bash
# Linux Non-Volatile Data Collection Script
# Save as collect_nonvolatile.sh

OUTPUT_DIR="/mnt/usb/case_001/nonvolatile"
mkdir -p $OUTPUT_DIR

echo "=== Collecting Non-Volatile Data ===" | tee $OUTPUT_DIR/collection.log

# System information
uname -a > $OUTPUT_DIR/uname.txt
cat /proc/cpuinfo > $OUTPUT_DIR/cpuinfo.txt
cat /proc/meminfo > $OUTPUT_DIR/meminfo.txt

# User accounts
cat /etc/passwd > $OUTPUT_DIR/passwd.txt
cat /etc/shadow > $OUTPUT_DIR/shadow.txt 2>/dev/null
cat /etc/group > $OUTPUT_DIR/group.txt

# Command history
for user in $(ls /home/); do
    cat /home/$user/.bash_history > $OUTPUT_DIR/bash_history_$user.txt 2>/dev/null
done
cat /root/.bash_history > $OUTPUT_DIR/bash_history_root.txt 2>/dev/null

# Log files
cp /var/log/auth.log $OUTPUT_DIR/auth.log 2>/dev/null
cp /var/log/syslog $OUTPUT_DIR/syslog 2>/dev/null
cp /var/log/kern.log $OUTPUT_DIR/kern.log 2>/dev/null

# Cron jobs
cat /etc/crontab > $OUTPUT_DIR/crontab.txt
ls -la /etc/cron* > $OUTPUT_DIR/cron_dirs.txt

# Installed packages
dpkg -l > $OUTPUT_DIR/dpkg_list.txt 2>/dev/null
rpm -qa > $OUTPUT_DIR/rpm_list.txt 2>/dev/null

echo "Collection complete. Output saved to $OUTPUT_DIR"
📋 Lab 3: Rootkit Detection Exercise
# Step 1: Update rkhunter and run scan
sudo rkhunter --update
sudo rkhunter --check --rwo > rkhunter_warnings.txt

# Step 2: Run chkrootkit
sudo chkrootkit > chkrootkit_results.txt

# Step 3: Manual checks
# Check for hidden processes
ps -ef | grep "^ "

# Check for listening ports
netstat -tulpn | grep LISTEN

# Check for suspicious SUID files
find / -perm -4000 -type f 2>/dev/null > suid_files.txt

# Step 4: Analyze results
cat rkhunter_warnings.txt
cat chkrootkit_results.txt
📋 Lab 4: Log Analysis and Timeline Reconstruction
# Step 1: Extract authentication logs for incident window
grep "Jan 15" /var/log/auth.log > incident_auth.txt

# Step 2: Extract system logs
grep "Jan 15" /var/log/syslog > incident_syslog.txt

# Step 3: Combine and sort
cat incident_auth.txt incident_syslog.txt | sort > incident_timeline.txt

# Step 4: Search for specific events
grep -E "Failed password|Accepted|sudo|session opened" incident_timeline.txt

# Step 5: Create timeline with The Sleuth Kit
fls -r -m / /dev/sda1 > bodyfile.txt
mactime -b bodyfile.txt -d > timeline.csv- Screenshots of each command execution
- Output files from collection scripts
- Analysis of findings (suspicious entries)
- Timeline of events
- Rootkit detection results
🛠️ Cyber Forensics Core Tools & Practical Usage
This module provides a comprehensive overview of essential digital forensics tools used by forensic investigators, incident responders, and law enforcement agencies worldwide. These tools are critical for evidence acquisition, analysis, recovery, and reporting in cybercrime investigations. Each tool is explained with practical use cases, forensic workflows, and legal considerations.
Using proper forensic tools ensures evidence integrity and court admissibility.
💾 Disk & Data Acquisition Tools
Tool 1: FTK Imager – Disk Imaging & Preview
FTK Imager is a free, widely-used forensic imaging tool that creates bit-for-bit copies of disks, drives, and memory. It allows preview of evidence without modifying original data.
- Free and easy to use
- Supports multiple forensic formats (E01, RAW, AFF)
- Built-in hash verification (MD5, SHA-1, SHA-256)
- Can preview disk contents without mounting
- Memory capture capability for live systems
📌 FTK Imager Forensic Workflow
- Select source (physical drive, logical drive, or image file)
- Choose destination format (E01 format recommended for court admissibility)
- Enable verification (hash calculation for integrity)
- Add case information (case number, evidence number, examiner name)
- Start acquisition and wait for completion
- Verify hash values match between source and image
📌 FTK Imager Installation (Windows)
1️⃣ Download from Exterro Website
https://www.exterro.com/digital-forensics-software/ftk-imager2️⃣ Run the Installer
Double-click FTK_Imager_Setup.exe
Follow the installation wizard
Accept the license agreement
Choose installation directory
Click Install
3️⃣ Launch FTK Imager
Start Menu → AccessData → FTK Imager📌 Basic FTK Imager Commands & Usage
FTK Imager is GUI-based, but here are the common workflows:
# Create a forensic image:
File → Create Disk Image → Select Source → Choose Destination → Add Image Information → Start

# Mount an image for read-only access:
File → Image Mounting → Select Image → Mount as read-only

# Capture memory (RAM):
File → Capture Memory → Select Destination → Capture

# Generate hash of a file:
Tools → Compute Hash Value → Select File → Get Hash
Create a forensic image of any storage device (Pendrive, Hard Disk, SSD, Memory Card, etc.) for analysis.
- Launch FTK Imager as Administrator
- Click File → Create Disk Image
- Select source type:
- Physical Drive - For entire physical disk (HDD, SSD, Pendrive, USB Drive)
- Logical Drive - For specific partition (C:, D:, etc.)
- Image File - To convert an existing image to another format
- Contents of a Folder - To image a specific folder
- Select your source device from the list of available drives:
- Physical Drive 0 - Usually the main system HDD/SSD
- Physical Drive 1 - Secondary drive or Pendrive
- Physical Drive 2 - External USB drive, Memory Card, etc.
- Click Finish
- Click the Add button to select destination
- Select image type:
- E01 (EnCase Evidence File) - Recommended for court, includes compression & metadata
- RAW (DD) - Bit-for-bit raw image, universal compatibility
- AFF (Advanced Forensic Format) - Open source forensic format
- SMART () -
- Click Next
- Enter case information:
- Case Number: Unique identifier for the case
- Evidence Number: Unique identifier for this evidence
- Examiner Name: Name of the forensic examiner
- Description: Optional description of the evidence
- Notes: Any additional case notes
- Click Next
- Recommended: Tick all three options:
- ✓ Use folder name as evidence number
- ✓ Use distinct case number per evidence
- ✓ Include hash values in report
- Select destination path and filename for the forensic image
- Configure the destination settings:
- Image Destination Folder: Select where to save the forensic image
- Image Filename: Enter a name for the image file
- Fragment Size: Set fragment size (explained in detail below)
- Compression: Set compression level (0=None to 9=Maximum)
- Use AD Encryption: Optional encryption for evidence
- Click Start to begin imaging
- Monitor the progress bar and wait for completion
- Verify hash values match between source and image:
- MD5 hash
- SHA-1 hash
- SHA-256 hash
- Save the verification report for chain of custody documentation
MD5: a1b2c3d4e5f678901234567890abcdefSHA-1: 1234567890abcdef1234567890abcdef12345678SHA-256: a1b2c3d4e5f678901234567890abcdef1234567890abcdef1234567890abcdef
Understanding Fragment Size (Image Segmentation)
What is Fragment Size? Fragment size determines how large each segment of the forensic image file will be. Instead of creating one massive file, FTK Imager can split the image into smaller, manageable pieces called fragments or segments.
- 0 (Zero) - No fragmentation, creates a single continuous file (default for RAW)
- 1500 MB - Creates 1.5 GB fragments (CD-ROM size)
- 700 MB - Creates 700 MB fragments (CD size)
- 4480 MB - Creates 4.48 GB fragments (DVD size)
- 4096 MB - Creates 4 GB fragments (FAT32 file size limit)
- 1024 MB - Creates 1 GB fragments
- When saving to FAT32 drives (max file size 4GB)
- For easier transfer across multiple storage devices
- To fit evidence on DVDs or other removable media
- For large drives (over 2TB) to avoid file system limitations
- To enable parallel processing of image segments
| Fragment Size | Use Case | Pros | Cons |
|---|---|---|---|
| 0 (No split) | Large drives, modern file systems | Single file, easier to manage | May exceed file system limits |
| 1500 MB | CD-ROM backup, evidence distribution | Standard size, widely compatible | Many fragments for large drives |
| 4096 MB (4GB) | FAT32 drives, USB pendrives | Respects FAT32 4GB limit | Legacy file system limitation |
| 4480 MB | DVD backup | Fits on single-layer DVD | DVDs are becoming obsolete |
                                                     pen32.E01     ← Fragment 1 (contains first 1500 MB)

                                                     pen32.E02     ← Fragment 2 (contains next 1500 MB)

                                                     pen32.E03     ← Fragment 3 (contains remaining data)

                                                     pen32.txt     ← Metadata and hash information
- Image Destination Folder:
C:\Users\shekh\OneDrive\Desktop\Cyber Forensics- Where the image will be saved - Image Filename:
pen32- Base name for the forensic image file - Fragment Size:
1500MB - Splits image into 1.5GB segments
- Compression (0-9):
0=Noneto9=Smallest- Balance between speed and size - Use AD Encryption: Optional encryption for sensitive evidence
- Format: Raw/dd (indicated by the folder path)
| Format | Compression | Metadata | Hash Verification | Court Acceptance |
|---|---|---|---|---|
| E01 (EnCase) | ✓ Yes | ✓ Yes | ✓ Embedded | ⭐⭐⭐⭐⭐ Highest |
| RAW (DD) (Raw) | ✗ No | ✗ No | ✓ External | ⭐⭐⭐⭐ High |
| AFF (Advanced) | ✓ Yes | ✓ Yes | ✓ Embedded | ⭐⭐⭐ Moderate |
Mount a forensic image as a read-only drive to explore contents without altering evidence.
- In FTK Imager, click File → Image Mounting
- Click Add and browse to select your E01 file (created from disk imaging)
- Select a Drive Letter for the new virtual drive (e.g., C, D, E, etc.)
- Choose mount type: Mount as read-only (ensures evidence integrity)
- Select Mount as removable media (optional)
- Click Mount
- Open File Explorer to access the mounted drive
Capture volatile memory (RAM) for analysis of running processes, network connections, encryption keys, and malware. RAM is the most volatile evidence and must be captured before system shutdown.
- Running processes (including malware)
- Active network connections
- Decrypted passwords and keys
- Command history (PowerShell, CMD)
- Fileless malware (exists only in RAM)
- Chat messages (Signal, WhatsApp Web)
- Clipboard contents
- Encryption keys (BitLocker, ransomware)
- Launch FTK Imager as Administrator (required for memory access)
- Click File → Capture Memory
- Select Destination Path where the memory dump will be saved
- Use an external forensic drive (not the suspect system's drive)
- Ensure sufficient free space (RAM size + 2-4 GB for pagefile)
- Enter a filename (e.g.,
case001_memory_dump_YYYYMMDD.mem) - Optional - Include Pagefile:
- ✓ Include pagefile (adds more data but increases file size)
- The pagefile contains memory pages written to disk
- Can contain additional forensic artifacts
- Click Capture Memory
- Monitor the progress bar - do NOT interrupt the capture
- Wait for the capture to complete
- Note the hash values generated for integrity verification:
- MD5 hash
- SHA-1 hash
- SHA-256 hash
- Save the hash values and capture log for chain of custody
- Store the memory dump file in a secure, evidence-grade location
MD5: 7f8e9a1b2c3d4e5f67890123456789abSHA-1: abcdef1234567890abcdef1234567890abcdef12SHA-256: 7f8e9a1b2c3d4e5f67890123456789abcdef1234567890abcdef1234567890ab
| Practice | Why It Matters |
|---|---|
| Capture RAM before disk imaging | RAM is more volatile than disk - data lost on power-off |
| Use external drive for destination | Avoid overwriting evidence on suspect system |
| Document system time before capture | Essential for timeline reconstruction |
| Don't close running applications | Closing apps may clear volatile evidence from RAM |
| Capture twice (before and after analysis) | Compare for changes in running processes |
# Identify OS profile
volatility -f memory.dump imageinfo

# List running processes
volatility -f memory.dump --profile=Win10x64 pslist

# List network connections
volatility -f memory.dump --profile=Win10x64 netscan

# Extract command history
volatility -f memory.dump --profile=Win10x64 cmdscan

# Detect injected code/malware
volatility -f memory.dump --profile=Win10x64 malfind

# Extract password hashes
volatility -f memory.dump --profile=Win10x64 hashdump- RAM is volatile – capture memory BEFORE powering off the system!
- Memory dumps can be very large (8GB to 64GB+), ensure sufficient storage space
- Document the capture time and system state for chain of custody
                                                 Evidence ID: MEM-2024-001

                                                 Description: RAM memory dump from suspect workstation

                                                 Source System: DESKTOP-XYZ123 (192.168.1.100)

                                                 Capture Date: 2024-01-15

                                                 Capture Time: 14:32:17 UTC

                                                 Capture Tool: FTK Imager v4.5.0

                                                 Destination File: case001_memory_dump_20240115.mem

                                                 File Size: 16,384,512,000 bytes (16 GB)

                                                 MD5 Hash: 7f8e9a1b2c3d4e5f67890123456789ab

                                                 SHA-256: 7f8e9a1b2c3d4e5f67890123456789abcdef...

                                                 Captured By: Examiner J. Doe

                                                 Chain of Custody: Sealed and stored in evidence locker #B12
Extract SYSTEM and SOFTWARE registry hives to analyze USB history, installed programs, user activity, and system configuration.
📌 Method 1: From Mounted Image
- Ensure your forensic image is mounted (see Lab 2)
- In FTK Imager, navigate to the mounted drive
- Browse to:
Windows\System32\config\ - Locate the following files:
- SYSTEM - Contains USB history, system settings
- SOFTWARE - Contains installed programs, user settings
- SAM - Contains user account passwords (optional)
- SECURITY - Contains security policies (optional)
- Right-click on each file → Export Files
- Select a destination folder for the exported registry hives
- Click OK to export
📌 Method 2: Using "Add All Attached Devices" (Live System)
- In FTK Imager, click File → Add All Attached Devices
- Expand the C: drive (system drive)
- Navigate to: Windows → System32 → config
- Search for SOFTWARE and SYSTEM files
- Right-click each file → Export Files
- Save to a forensic destination folder (external drive or network share)
- Document hash values for chain of custody
- SYSTEM: USB device history (
USBSTOR), mounted devices, system startup - SOFTWARE: Installed programs, user activity, Windows version
- Use tools like Registry Explorer (Zimmerman Tools) for analysis
| Lab | Purpose | Menu Path | Output |
|---|---|---|---|
| Lab 1 | Create Forensic Image | File → Create Disk Image | E01/RAW/AFF forensic image file |
| Lab 2 | Mount Forensic Image | File → Image Mounting | Read-only virtual drive |
| Lab 3 | RAM Imaging | File → Capture Memory | .mem memory dump file |
| Lab 4 | Export Registry Hives | Navigate to Windows\System32\config | SYSTEM, SOFTWARE files |
FTK Imager should only be used on devices you own or have explicit legal authorization to examine. Unauthorized access to digital evidence is illegal and violates chain of custody.
Tool 2: DD (Data Dump) – Linux Disk Imaging
DD (Data Dump) is a powerful command-line disk imaging tool available on Linux/Unix systems. It creates raw bit-for-bit copies of storage media, making it a staple in forensic investigations.
- Built into every Linux/Unix system (no installation required)
- Creates exact bit-for-bit copies including deleted data
- Can copy to/from devices, files, or network streams
- Highly configurable with block size and error handling options
- Can create compressed or split images using pipes
📌 DD Forensic Workflow
- Identify source device (e.g., /dev/sda, /dev/sdb1)
- Mount source device with write blocker
- Calculate hash of source device for verification
- Execute DD command with appropriate parameters
- Calculate hash of output image
- Compare hash values to verify integrity
📌 DD Installation
DD comes pre-installed on all Linux, macOS, and BSD systems. No installation is required.
1️⃣ Verify DD is installed
which dddd --version📌 Basic DD Commands
Basic DD command structure:
dd if=<source> of=<destination> bs=<block_size> conv=<conversion_options>Example 1: Create raw disk image
dd if=/dev/sda of=/path/to/image.dd bs=4096 conv=noerror,sync- if → Input file (source disk)
- of → Output file (destination image)
- bs → Block size (4096 bytes recommended)
- conv=noerror,sync → Continue on read errors, pad with zeros
Example 2: Create image with progress display
dd if=/dev/sda of=/path/to/image.dd bs=4096 conv=noerror,sync status=progressExample 3: Create compressed image
dd if=/dev/sda bs=4096 conv=noerror,sync | gzip -c > image.dd.gzExample 4: Create split image (2GB parts)
dd if=/dev/sda bs=4096 conv=noerror,sync | split -b 2G - image.dd.partExample 5: Calculate hash of image
dd if=/dev/sda bs=4096 conv=noerror,sync | sha256sum > image.hashDD should only be used on storage devices you own or have explicit legal authorization to image. Unauthorized imaging of evidence may violate chain of custody rules.
Tool 3: Guymager – GUI Forensic Imager
Guymager is a Linux GUI-based forensic imaging tool with parallel acquisition capabilities and support for multiple formats (E01, RAW, AFF). It is widely used in forensic laboratories.
- User-friendly graphical interface
- Multi-threaded imaging for faster acquisition
- Built-in hash verification (MD5, SHA-1, SHA-256)
- Supports network imaging
- Case metadata integration
- Can pause and resume imaging operations
📌 Guymager Forensic Workflow
- Launch Guymager and detect connected drives
- Select source drive to image
- Configure image format (E01 recommended for court)
- Enter case information (case number, evidence number, examiner)
- Select destination path
- Start acquisition (supports multiple simultaneous acquisitions)
- Verify hash values after completion
📌 Guymager Installation (Kali Linux / Ubuntu)
1️⃣ Update System
sudo apt update && sudo apt upgrade -y2️⃣ Install Guymager
sudo apt install guymager -y3️⃣ Launch Guymager
sudo guymager📌 Guymager Basic Usage
Guymager is GUI-based, but here are the common workflows:
# Detect all connected drives
sudo guymager

# Right-click on drive → Acquire image
# Select format: E01 (EnCase), RAW (DD), or AFF
# Enter case details
# Choose destination folder
# Click StartGuymager should only be used on devices you own or have explicit legal authorization to examine.
Tool 4: dc3dd – Enhanced DD Tool
dc3dd is an enhanced version of DD developed by the DoD Cyber Crime Center (DC3). It features progress reporting, hash verification, and improved error handling.
- Built-in hash verification (MD5, SHA-1, SHA-256, SHA-512)
- Real-time progress reporting
- Multiple output files support
- Split image creation
- Pattern writing for drive wiping
- Error handling and logging
📌 dc3dd Forensic Workflow
- Connect source drive using write blocker
- Identify source device (/dev/sda, /dev/sdb)
- Execute dc3dd with hash verification
- Monitor progress in real-time
- Verify hash values match
- Document the process in case notes
📌 dc3dd Installation
1️⃣ Install on Kali Linux / Ubuntu
sudo apt install dc3dd -y2️⃣ Verify Installation
dc3dd --help📌 Basic dc3dd Commands
Example 1: Create image with hash verification
dc3dd if=/dev/sda of=image.dd hash=sha256 log=acquisition.logExample 2: Create image with progress display
dc3dd if=/dev/sda of=image.dd hash=sha256 verbose=onExample 3: Create split image (2GB parts)
dc3dd if=/dev/sda of=image.dd.000 of=image.dd.001 of=image.dd.002 hash=sha256Example 4: Multiple hash algorithms
dc3dd if=/dev/sda of=image.dd hash=md5 hash=sha256 hash=sha512 log=acquisition.logdc3dd should only be used on devices you own or have explicit legal authorization to image.
🔒 Write Blockers (Evidence Integrity)
Tool 1: Hardware & Software Write Blockers – Evidence Integrity Protection
Write Blockers are essential forensic devices that prevent any modification to original evidence during acquisition and analysis. They ensure the integrity of digital evidence for court admissibility and are considered the "golden rule" of digital forensics.
- Prevent accidental modification of evidence (even by OS write operations)
- Maintain chain of custody integrity and evidence authenticity
- Court-admissible evidence handling (required for legal proceedings)
- OS-independent protection (works across Windows, Linux, macOS)
- Forensically sound acquisitions (preserves original state)
- Prevents timestamp changes (access time, metadata modifications)
- Protects against malware on suspect drives (isolates during acquisition)
Never connect a suspect drive to a computer without a write blocker! Even simply mounting a drive can modify access timestamps, create temporary files, and alter evidence. This can make evidence inadmissible in court.
📌 Types of Write Blockers
| Type | Examples | Advantages | Limitations | Court Acceptance |
|---|---|---|---|---|
| Hardware Write Blockers | Tableau, WiebeTech, Logicube, Atola, Digital Intelligence | Court-accepted (preferred), OS-independent, hardware-level protection, no software configuration | Costly ($500-$2000), requires physical connection, additional cables/power | ✓ Highly Accepted |
| Software Write Blockers | FTK Imager read-only, Linux mount -r, macOS Disk Utility, write-blocker drivers | Free, convenient, no additional hardware, quick setup | Less trusted in court (can be bypassed by malware), OS-dependent, kernel-level risks | Limited / Conditional |
| Hybrid Write Blockers | Tableau T356 (USB+FireWire), Atola Insight (hardware+software) | Best of both worlds, configurable, advanced features | Very costly ($1500-$4000), complex setup | ✓ Highly Accepted |
🛡️ Hardware Write Blockers - Complete Guide
What is a Hardware Write Blocker?
A hardware write blocker is a physical device that sits between the forensic workstation and the suspect drive. It intercepts write commands and blocks them from reaching the drive while allowing read commands to pass through. This is implemented at the hardware/firmware level, making it tamper-proof.
Popular Hardware Write Blocker Vendors
| Vendor | Model | Interface | Drive Types | Approx. Price |
|---|---|---|---|---|
| Tableau | T8u (USB 3.0), T356 (Forensic Bridge), T4 (SATA) | USB 3.0, Thunderbolt, FireWire, SATA | SATA, IDE, USB, SD, mSATA, NVMe | $800 - $1500 |
| WiebeTech | Forensic Combo Dock, SATA/IDE Bridge, USB Bridge | USB 3.0, eSATA, Thunderbolt | SATA, IDE, USB, SAS, NVMe | $600 - $1200 |
| Atola | Insight Forensic, TaskForce | USB 3.0, eSATA, Thunderbolt | SATA, IDE, USB, NVMe, SAS | $1500 - $4000 |
| Logicube | Forensic Guardian, 3D Write Blocker | USB 3.0, eSATA | SATA, IDE, USB | $500 - $800 |
Step-by-Step Hardware Write Blocker Setup
- Power off the forensic workstation - Prevent power surges
- Connect write blocker to forensic workstation via USB/Thunderbolt/eSATA cable
- Connect write blocker to power source - Use included power adapter
- Connect suspect drive to write blocker's input port (marked "Drive" or "Source")
- Power on the write blocker - Wait for self-test (10-15 seconds)
- Verify write protection LED is active (usually green or blue LED)
- Power on forensic workstation (if powered off)
- Verify drive is detected as read-only in forensic software
- Test write protection - Attempt to create a file on the drive (should fail)
- Proceed with forensic imaging using FTK Imager, dd, or other tools
Verifying Hardware Write Blocker Functionality
# Windows: Check if drive is write-protected
# Open Command Prompt as Administrator
diskpart
list disk
select disk X (where X is suspect drive)
attributes disk

# Expected output: "Current Read-only State: Yes"

# Linux: Check write status
sudo hdparm -r /dev/sdb
# Expected output: "readonly = 1"

# Test write operation (should fail)
echo "test" > /mnt/evidence/test.txt
# Expected: "Read-only file system" error

# Using FTK Imager (Windows)
# The drive will appear with a red lock icon indicating read-only
Common Hardware Write Blocker Models
# Tableau T8u Forensic USB 3.0 Write Blocker
- Interface: USB 3.0 (host) to USB 3.0 (drive)
- Supported drives: SATA, SAS, USB storage
- Features: LED indicators, write-protect switch, hot-swappable

# Tableau T356 Forensic Bridge
- Interface: USB 3.0 / FireWire 800
- Supported drives: SATA, IDE, USB
- Features: Multiple interface support, write-blocked and passthrough modes

# WiebeTech Forensic Combo Dock
- Interface: USB 3.0 / eSATA
- Supported drives: SATA, IDE (with adapter)
- Features: Dual drive cloning, hardware erasure

# Atola Insight Forensic
- Interface: USB 3.0 / Thunderbolt
- Supported drives: SATA, NVMe, SAS, USB
- Features: Advanced diagnostics, imaging, hash calculation, write-blocking
🖥️ Software Write Blockers - Complete Guide
What is a Software Write Blocker?
A software write blocker operates at the operating system or driver level, intercepting write commands before they reach the drive hardware. While convenient, they are less trusted in court because malware or kernel exploits could potentially bypass them.
Windows Software Write Blockers
Method 1: FTK Imager Read-Only Mode
# FTK Imager automatically opens all drives in read-only mode
# Steps:
1. Launch FTK Imager as Administrator
2. File → Add Evidence Item → Physical Drive
3. Select suspect drive
4. Drive is automatically mounted as read-only (no configuration needed)
5. Verify read-only status in bottom status bar

# Verification:
# Attempt to export a file to the suspect drive (will fail)
# FTK Imager shows "Access Denied" error
Method 2: Windows Registry Write Protection
# Enable write protection for all USB drives (Registry method)
# Run as Administrator
reg add "HKLM\SYSTEM\CurrentControlSet\Control\StorageDevicePolicies" /v WriteProtect /t REG_DWORD /d 1 /f

# To disable:
reg add "HKLM\SYSTEM\CurrentControlSet\Control\StorageDevicePolicies" /v WriteProtect /t REG_DWORD /d 0 /f

# Note: Requires reboot to take effect
Method 3: Mount as Read-Only with Arsenal Image Mounter
# Arsenal Image Mounter (free tool)
# Mount forensic images as read-only virtual drives
1. Launch Arsenal Image Mounter as Administrator
2. File → Mount Image File
3. Select forensic image (E01, DD, RAW, VMDK)
4. Check "Mount as read-only"
5. Click "Mount"
# Drive appears in Windows Explorer as read-only (blue icon)
🐧 Linux Software Write Blockers
Method 1: Mount with Read-Only Flag
# Identify the drive
sudo fdisk -l
# Example: /dev/sdb

# Mount as read-only (most common method)
sudo mount -o ro /dev/sdb1 /mnt/evidence

# Verify read-only status
mount | grep /mnt/evidence
# Expected output: "ro" (read-only)

# Alternative: Mount with explicit read-only and noatime
sudo mount -o ro,noatime /dev/sdb1 /mnt/evidence

# Verify by attempting to write
sudo touch /mnt/evidence/test.txt
# Expected: "Read-only file system" error
Method 2: Block Device Read-Only
# Set block device to read-only mode
sudo blockdev --setro /dev/sdb

# Verify read-only status
sudo blockdev --getro /dev/sdb
# Expected output: "1" (read-only)

# Mount the device
sudo mount /dev/sdb1 /mnt/evidence

# After analysis, set back to read-write (if needed)
sudo blockdev --setrw /dev/sdb
Method 3: Using losetup for Image Files
# Mount forensic image as read-only loop device
sudo losetup -r /dev/loop0 evidence.dd

# Verify read-only
losetup -l /dev/loop0
# Expected output: "READ-ONLY" flag

# Mount the loop device
sudo mount -o ro /dev/loop0 /mnt/evidence

# Clean up
sudo umount /mnt/evidence
sudo losetup -d /dev/loop0
🍎 macOS Software Write Blockers
# Method 1: Mount as read-only (Terminal)
sudo mount -o rdonly /dev/disk2s1 /Volumes/Evidence

# Method 2: Disk Utility (GUI)
1. Open Disk Utility
2. Select the suspect drive
3. File → Mount → Select "Read-only" option
4. Drive mounts with read-only icon

# Method 3: Using hdiutil (for disk images)
hdiutil attach evidence.dmg -readonly -mountpoint /Volumes/Evidence

# Verify read-only status
mount | grep Evidence
# Expected output: "read-only"
📊 Hardware vs Software Write Blockers: Detailed Comparison
| Feature | Hardware Write Blocker | Software Write Blocker |
|---|---|---|
| Court Acceptance | ✓ Highly accepted - industry standard | Limited acceptance - often requires additional validation |
| Cost | $500 - $4000 (significant investment) | ✓ Free (built into OS or free tools) |
| Protection Level | ✓ Hardware/firmware level - tamper-proof | OS/kernel level - potential bypass |
| Ease of Use | Requires physical setup, cables, power | ✓ Plug-and-play, no additional hardware |
| Portability | Bulkier, requires power source | ✓ No extra equipment to carry |
| Malware Protection | ✓ Protects against malware on suspect drive | Malware could bypass software write blocker |
| Performance | ✓ Full bus speed, no overhead | ✓ Minimal overhead |
| Best Use Case | Court cases, law enforcement, formal investigations | Triage, training, preliminary analysis, resource-constrained |
🎯 Practical Forensic Use Cases
Use Case 1: Suspect Drive Acquisition (Hardware Write Blocker)
# Scenario: Seized hard drive must be imaged for court evidence

# Equipment needed:
- Forensic workstation
- Tableau T8u or similar hardware write blocker
- SATA to USB adapter or direct SATA cable
- Power source for write blocker

# Procedure:
1. Connect write blocker to forensic workstation via USB 3.0
2. Connect write blocker to power source
3. Connect suspect SATA drive to write blocker's input port
4. Power on write blocker (verify green LED)
5. Launch FTK Imager
6. File → Add Evidence Item → Physical Drive → Select drive
7. Verify drive appears with red lock (read-only)
8. File → Create Disk Image → Select E01 format
9. Add case information (examiner, case number)
10. Start acquisition (verifies hash automatically)

# Verification:
- FTK Imager calculates and verifies MD5/SHA1 hashes
- Write blocker prevented any modification during imaging
Use Case 2: Quick Triage without Hardware (Software Write Blocker)
# Scenario: Rapid assessment of multiple drives, not for court

# Using Linux software write blocker:
# Step 1: Mount drive as read-only
sudo mount -o ro /dev/sdb1 /mnt/evidence

# Step 2: Verify read-only
mount | grep /mnt/evidence | grep "ro"

# Step 3: Quick triage search
grep -r "password" /mnt/evidence/
find /mnt/evidence -name "*.docx" -size +1M

# Step 4: Create logical image (dd)
sudo dd if=/dev/sdb of=evidence.dd bs=4M status=progress

# Step 5: Calculate hash of image
sha256sum evidence.dd > evidence.dd.sha256

# Step 6: Unmount when done
sudo umount /mnt/evidence
Use Case 3: Forensic Image Analysis with Write Blocker
# Scenario: Analyzing forensic image without write blocker

# Best practice: Always mount images as read-only
# Using FTK Imager (Windows):
File → Add Evidence Item → Image File → Select E01/DD
# Automatically mounted as read-only

# Using Linux (losetup + mount):
# Mount image as read-only loop device
sudo losetup -r -f evidence.dd
sudo mount -o ro /dev/loop0 /mnt/analysis

# Using Arsenal Image Mounter (Windows):
# Mount image as read-only virtual drive
# Access in any forensic tool as read-only
✅ How to Test Write Blocker Functionality
Hardware Write Blocker Test Procedure
# Step 1: Connect write blocker and suspect drive
# Step 2: Verify LED indicators (write-blocked mode)
# Step 3: Mount the drive (should appear as read-only)
# Step 4: Attempt to write a test file

# Windows test:
echo "test" > X:\write_test.txt
# Expected: "Access Denied" or "The media is write-protected"

# Linux test:
sudo touch /mnt/evidence/write_test.txt
# Expected: "Read-only file system"

# Step 5: Verify no new files created
ls -la X:\ | grep write_test.txt
# Expected: No output (file not created)

# Step 6: Document test results in case notes
Software Write Blocker Test Procedure
# Test if software write blocker is working
# Windows (FTK Imager):
# FTK Imager shows red lock icon on drive

# Linux:
mount | grep "ro"  # Should show read-only

# Test write operation:
touch /mnt/evidence/test.txt
# Should return: "touch: cannot touch 'test.txt': Read-only file system"

# Alternative: Use blockdev command
sudo blockdev --getro /dev/sdb
# Output: 1 (read-only) or 0 (read-write)
⚠️ Troubleshooting Common Write Blocker Issues
| Issue | Possible Cause | Solution |
|---|---|---|
| Drive not detected | Loose cable, insufficient power, driver issue | Check all cable connections; use external power; update drivers |
| Write blocker LED not lit | No power, device failure, incorrect connection | Check power adapter; test with different port; replace device |
| Drive mounts as read-write (hardware blocker) | Blocker not in write-protect mode, device failure | Verify mode switch; test with known good drive; replace blocker |
| Cannot mount drive in Linux (software blocker) | Wrong partition, filesystem corruption, improper mount options | Check partitions with fdisk -l; use mount -t auto |
| Slow imaging speed | USB 2.0 connection, old write blocker, drive issues | Use USB 3.0 or Thunderbolt; update firmware; replace blocker |
| Write blocker overheating | Prolonged use, poor ventilation, device fault | Allow cooling; improve airflow; replace device |
📋 Forensic Best Practices for Write Blockers
- Always use hardware write blockers for court evidence - Software blockers may not be accepted
- Test write blocker before each use - Verify with known drive before suspect drive
- Document write blocker usage - Record make, model, serial number in case notes
- Use write blocker for ALL drive connections - Including USB drives, memory cards, SSDs
- Never bypass write blocker - Even for "quick checks" - modifications are permanent
- Keep write blocker firmware updated - Manufacturers release updates for new drive types
- Use write blocker with forensic images - Mount images as read-only even without hardware
- Have backup write blockers - Equipment can fail; have spare available
- Train all examiners - Every team member must understand write blocker importance
- Calibrate write blockers annually - Some labs require certification/calibration
- Use write blocker for memory cards - SD cards, microSD, CompactFlash also need protection
- Document any write operations - If write blocker fails, document immediately
⚖️ Court Acceptance and Legal Considerations
Hardware Write Blocker in Court
- Widely accepted as industry standard (Daubert/Frye hearings)
- Many vendors provide affidavits of write-blocker functionality
- Forensic examiners can testify to proper use and testing
- Case law supports hardware write blocker usage (US v. O'Keefe, 2008)
- Recommended for all criminal cases and civil litigation
Software Write Blocker in Court
- Less widely accepted; may require additional validation
- Examiner must testify to testing and limitations
- Some courts have accepted with proper documentation
- Recommended only for consent searches or non-litigation matters
- Always use hardware blocker for evidence that will go to court
Documenting Write Blocker Usage for Court
# Required documentation in case notes:
- Make and model of write blocker (e.g., Tableau T8u Forensic USB 3.0)
- Serial number of write blocker
- Date and time of use
- Examiner name
- Test performed before use (with results)
- Suspect drive make, model, serial number
- Connection method (SATA to USB, direct SATA, etc.)
- Verification that drive mounted as read-only
- Any issues encountered and resolution
- Signature of examiner

# Example entry:
"2024-01-15 09:30 - Examiner Smith connected Tableau T8u (SN: T8U-12345) to forensic workstation.
Write blocker tested with known clean drive - write protection verified.
Suspect Seagate ST1000LM024 (SN: 123456789) connected via SATA to Tableau input.
Drive detected as read-only in FTK Imager (red lock icon).
Imaging commenced at 09:45. No write operations occurred."
📋 Quick Reference Card
# Linux - Mount read-only
sudo mount -o ro /dev/sdb1 /mnt/evidence

# Linux - Block device read-only
sudo blockdev --setro /dev/sdb

# Windows - FTK Imager (auto read-only)
File → Add Evidence Item → Physical Drive

# Windows - Registry write protection
reg add "HKLM\SYSTEM\CurrentControlSet\Control\StorageDevicePolicies" /v WriteProtect /t REG_DWORD /d 1 /f

# macOS - Mount read-only
sudo mount -o rdonly /dev/disk2s1 /Volumes/Evidence

# Test write protection (Linux)
touch /mnt/evidence/test.txt  # Should fail with "Read-only file system"

# Test write protection (Windows)
echo test > X:\test.txt # Should fail with "Access Denied"Never connect a suspect drive without a write blocker!
Never connect a suspect drive to a computer without a write blocker! Even simply mounting a drive can modify access timestamps, create temporary files (like thumbs.db, .DS_Store), and alter evidence. This single mistake can make your entire investigation inadmissible in court. Hardware write blockers are the only court-accepted method.
📁 File System & Analysis Tools
Tool 1: Autopsy / The Sleuth Kit – Open Source Forensics Platform
Autopsy (GUI) and The Sleuth Kit (TSK) (CLI) are open-source forensic platforms for file system analysis, deleted file recovery, and timeline generation. They are widely used in law enforcement and corporate investigations worldwide.
- Free and open-source - No licensing costs, community-driven development
- Modular architecture with plugins (extend functionality)
- Supports all major file systems (NTFS, FAT, exFAT, EXT, HFS+, APFS, XFS)
- Automated analysis and reporting with one-click reports
- Keyword search and indexing with Solr/Lucene backend
- Registry and event log parsing (Windows artifacts)
- Timeline generation with visualization
- Hash database integration (NSRL, custom hash sets)
- Email parsing (PST, EML, MBOX)
- Web artifact extraction (browser history, downloads, cookies)
📌 Autopsy Forensic Workflow
- Create a new case - Enter case metadata, examiner info, case number
- Add evidence - Disk image, local drive, folder, or memory dump
- Select analysis modules - Choose ingest modules based on case needs
- Ingest data - File system parsing, hash calculation, keyword indexing, registry analysis
- Review results - Examine findings in organized views (file types, deleted files, timeline)
- Bookmark relevant artifacts - Tag evidence for report inclusion
- Generate forensic report - Export findings in HTML, PDF, Excel, or body file format
📥 Complete Step-by-Step Installation Guide
🪟 Windows Installation (Detailed)
- Download the installer from
https://www.autopsy.com/download/ - Run the .exe installer as Administrator (right-click → Run as Administrator)
- Accept the license agreement and click Next
- Choose installation directory (default:
C:\Program Files\Autopsy) - Select components:
- ✓ Autopsy Core (required)
- ✓ The Sleuth Kit (bundled, required)
- ✓ Java Runtime (if not already installed)
- ✓ Sample cases (optional, for training)
- Choose Start Menu folder (default: Autopsy)
- Click "Install" and wait for completion (2-3 minutes)
- Click "Finish" to launch Autopsy
🐧 Linux (Kali / Ubuntu / Debian) Installation
# Step 1: Update system packages
sudo apt update && sudo apt upgrade -y

# Step 2: Install Autopsy and TSK from repositories
sudo apt install autopsy sleuthkit -y

# Step 3: Install Java (if not present)
sudo apt install default-jdk -y

# Step 4: Verify installation
autopsy --version
tsk_loadver

# Step 5: Start Autopsy web service (default port 9999)
sudo autopsy

# Step 6: Access Autopsy web interface
# Open browser to: http://localhost:9999/autopsy

# Step 7: (Optional) Run Autopsy on different port
autopsy -p 8888
🍎 macOS Installation
# Method 1: Using Homebrew (recommended)
brew update
brew install sleuthkit
brew install autopsy

# Method 2: Download DMG from official website
# https://www.autopsy.com/download/mac/

# Start Autopsy
sudo autopsy

# Access at: http://localhost:9999/autopsy📂 Step-by-Step: Creating Your First Forensic Case
1️⃣ Launch Autopsy and Create New Case
- Open Autopsy (Windows: Start Menu; Linux:
http://localhost:9999/autopsy) - Click "Create New Case" button
- Enter Case Name (e.g., "Corporate_Investigation_2024") - use descriptive names
- Enter Case Directory (e.g.,
C:\Cases\Corporate_Investigation_2024) - use external drive - Add Case Number (e.g., "INV-2024-001") - for tracking and court
- Add Examiner Name (e.g., "Forensic Analyst Smith") - full name for chain of custody
- Click "Next" to proceed
2️⃣ Add Evidence Source
- Click "Add Evidence Source" button
- Select Data Source Type:
- Disk Image or VM File - For forensic images (E01, DD, RAW, AFF, VMDK, VHD)
- Local Drive - For direct disk access (use with hardware write-blocker)
- Logical File - For single files or folders (triage)
- Browse and select your evidence file
- Configure time zone for accurate timestamp analysis (UTC vs local)
- Select time zone offset (e.g., UTC-5 for Eastern Time)
- Click "Next" to start ingestion configuration
3️⃣ Select Ingest Modules
Ingest modules process the evidence automatically. Select modules based on case requirements:
| Module | Purpose | Processing Time | Recommended |
|---|---|---|---|
| File System Parser | Parses file system structure (NTFS, FAT, EXT, HFS+) | Medium (10-30 min per 100GB) | ✓ Always |
| Hash Database Lookup | Identifies known good/bad files (NSRL, custom hash sets) | Fast (5-10 min per 100GB) | ✓ Always |
| Keyword Search | Searches for custom keywords in file content and metadata | Slow (30-60 min per 100GB) | ✓ Recommended |
| Recent Activity | Analyzes recent documents, web activity, and user artifacts | Medium (15-30 min per 100GB) | ✓ Recommended |
| Email Parser | Parses Outlook PST, OST, and MBOX files | Slow (30-60 min per 10,000 emails) | Optional (if email evidence exists) |
| Registry Analyzer | Parses Windows Registry (NTUSER.DAT, SYSTEM, SOFTWARE) | Fast (5-10 min) | ✓ Recommended (Windows evidence) |
| Web Artifacts | Extracts browser history, downloads, cookies, bookmarks | Medium (10-20 min per user) | ✓ Recommended |
| PhotoRec File Carver | Carves deleted files by signature (JPEG, PDF, DOC, ZIP) | Very Slow (2-4 hours per 100GB) | Optional (if file carving needed) |
4️⃣ Configure Ingest Options
# For each module, configure specific options:

# Hash Database Lookup:
- NSRL path: C:\nsrl\NSRL_File.txt (download from NIST)
- Custom hash set: C:\Cases\hash_sets\known_bad.txt
- Minimum file size to hash: 0 bytes (hash all)

# Keyword Search:
- Keyword list file: C:\Cases\keywords.txt (one keyword per line)
- File type filters: .docx,.pdf,.xlsx,.txt,.zip
- Enable indexing: Yes (for faster subsequent searches)

# Timeline:
- Granularity: Seconds (for incident response) or Minutes (for general)
- Include deleted files: Yes
- Include unallocated space: No (slower)

# File Type Filters (exclude known noise):
- Exclude: .dll, .sys, .exe (Windows system files)
- Exclude: thumbs.db, .DS_Store (system metadata)
🧭 Navigating the Autopsy Interface - Complete Guide
📊 Main Dashboard Views
| View | Location | Description | Best For |
|---|---|---|---|
| Summary | Home tab | Case statistics, ingestion status, file counts, hash matches | Overview of case progress |
| Directory Tree | Left sidebar | File system hierarchy including deleted files (marked with X) | Browsing folder structure |
| File Types | Views → File Types | Files grouped by extension and MIME type with counts | Finding all images, documents, or executables |
| Deleted Files | Views → Deleted Files | All recoverable deleted files (red X icon) | Recovering deleted evidence |
| Results | Results tab | Findings from ingest modules (keyword hits, hash matches, email) | Reviewing automated analysis results |
| Tags | Tags tab | User-created bookmarks with categories and comments | Organizing evidence for report |
| Timeline | Views → Timeline | Chronological visualization of file activity (MACB times) | Reconstructing user activity during incident |
🔍 How to Analyze Different Artifacts
📁 Finding Deleted Files
- Navigate to "Deleted Files" in the left sidebar under Views
- Review the list of recoverable files (marked with red X icon)
- Filter by file type, size, or date modified using filter bar at top
- Preview file content by double-clicking (if metadata available)
- Right-click and select "Extract File" to recover
- Choose extraction location (external drive recommended, NOT case folder)
- Verify recovered file with hash calculation (Tools → Compute Hash)
🔎 Running Keyword Searches
- Go to "Keyword Search" under Views in left sidebar
- Enter search terms (supports Boolean operators: AND, OR, NOT)
- Select search scope:
- All files (includes allocated and unallocated space)
- Allocated space only (files still present in file system)
- Unallocated space only (deleted files, faster for carving)
- Specific directory (browse to folder)
- Choose encoding (UTF-8, UTF-16, ASCII, Latin-1)
- Select file types to search (documents, images, or all)
- Click "Search" and monitor progress bar
- Review results in Results tab (sortable by file path, hit count, context)
- Double-click results to view context in Content Viewer (keyword highlighted)
- Right-click results to bookmark or extract
📅 Creating a Forensic Timeline
- Navigate to "Timeline" in the left sidebar under Views
- Select time range:
- Preset: Last day, Last week, Last month, Last year
- Custom: Enter start and end dates (e.g., incident window)
- All time (for complete history, slower)
- Choose event types to display (check boxes):
- File creation (C - Created)
- File modification (M - Modified)
- File access (A - Accessed)
- File metadata changes (B - Born/Changed)
- Registry changes (if processed)
- Web history (if processed)
- View timeline in list view (chronological table) or chart view (visual density heatmap)
- Filter by file path, extension, or size using filter bar
- Click on any event to view file details in bottom panel
- Right-click events to bookmark or extract files
- Export timeline as CSV for external analysis (File → Export → CSV)
🏷️ Tagging and Bookmarking Evidence
- Right-click on any file, artifact, or search result
- Select "Tag" → Choose tag type:
- Suspicious - Potentially malicious files or activity
- Notable - Important evidence for case
- Exculpatory - Evidence that clears suspect
- Bookmark - For later review (temporary)
- Custom - Create your own category
- Add comment explaining why tagged (required for court)
- View all tags in the "Tags" section (left sidebar)
- Filter tags by category, user, or date range
- Generate report including only tagged items (Report → Include Tagged Items)
- Export tagged items list to CSV for case management
⌨️ The Sleuth Kit (TSK) - Complete Command Reference
📂 File System Layer Commands
# mmls - Display partition layout (find correct offset)
mmls image.dd

# fsstat - Display file system details (type, block size, inodes)
fsstat -o 2048 image.dd

# fls - List files and directories (including deleted)
fls -r -o 2048 image.dd > all_files.txt
fls -d -o 2048 image.dd          # Show only deleted files
fls -r -p -o 2048 image.dd       # Show full paths

# icat - Extract file by inode number (recover deleted files)
icat -o 2048 image.dd 12345 > recovered_file.pdf
icat -r -o 2048 image.dd 12345   # Recover deleted version

# ils - List inode information (metadata)
ils -o 2048 image.dd > all_inodes.txt
ils -a -o 2048 image.dd          # Show all inodes including unallocated

# ifind - Find inode by file name or path
ifind -n "secret.txt" image.dd
ifind -d 12345 image.dd          # Find directory entry

# istat - Display detailed inode information
istat -o 2048 image.dd 12345

# dcat - Display raw data from a disk sector
dcat -o 2048 image.dd 1000 50    # 50 sectors starting at sector 1000

# dls - Extract unallocated space (for file carving)
dls -o 2048 image.dd > unallocated.dd
dls -l -o 2048 image.dd          # Show only unallocated clusters
📅 Timeline Creation Commands
# fls -m - Create body file for timeline (MACB times)
fls -r -m C: -o 2048 image.dd > bodyfile.txt

# mac-robber - Extract MAC times from mounted directory
mac-robber /mnt/evidence > bodyfile.txt

# mactime - Generate timeline from body file
mactime -b bodyfile.txt -d > timeline.csv
mactime -b bodyfile.txt -d -h 2024-01-01..2024-01-31 > timeline_range.csv
mactime -b bodyfile.txt -d -y > timeline_by_year.csv   # Group by year

# Analyze timeline with grep
cat timeline.csv | grep ".exe" > executable_activity.txt
cat timeline.csv | grep "deleted" > deleted_files_timeline.txt
cat timeline.csv | grep "2024-01-15" > incident_day_timeline.txt

# Sort timeline chronologically
sort -k2 timeline.csv > sorted_timeline.csv
🔐 Hash Database Commands
# md5sum - Generate MD5 hash of a file
md5sum evidence_file.exe

# sha256sum - Generate SHA-256 hash (more secure, court-admissible)
sha256sum evidence_file.exe

# hfind - Lookup hash in hash database (NSRL or custom)
hfind -i nsrl hash_database.db -f hash_list.txt
hfind -i md5sum my_hashes.db -f suspect_hashes.txt

# sorter - Sort files by type and hash (organize evidence)
sorter -d output_dir -h hash_db -f -e image.dd
sorter -d output_dir -n -s 1000000 image.dd  # Min file size 1MB

# Generate hash set from directory
find /mnt/evidence -type f -exec sha256sum {} \; > custom_hash_set.txt
🧩 File Carving Commands
# foremost - Carve files by headers/footers (configurable)
foremost -i image.dd -o carved_output
foremost -i image.dd -o carved_output -t jpg,pdf,doc,zip  # Specify types
foremost -i unallocated.dd -o carved_output -q            # Quiet mode

# scalpel - Fast file carving with configuration file
scalpel -c scalpel.conf -o output_dir image.dd
scalpel -c scalpel.conf -o output_dir -b -n image.dd      # Brief mode, no logging

# photorec - Recover photos and documents (TestDisk suite)
photorec /d recovery_folder /log photorec.log image.dd
photorec /d recovery_folder /cmd image.dd                 # Command line mode

# Configuration files location:
# foremost: /etc/foremost.conf
# scalpel: /etc/scalpel/scalpel.conf
🎯 Practical Analysis Examples
Example 1: Recovering Deleted Files (Data Theft Case)
# Scenario: Employee deleted incriminating files before leaving

# Step 1: List all files including deleted, save to file
fls -r -o 2048 suspect_image.dd > all_files.txt

# Step 2: Find deleted files (marked with '++' or '*')
grep "++" all_files.txt > deleted_files.txt
grep "\*" all_files.txt >> deleted_files.txt

# Step 3: Count deleted files by type
grep ".docx" deleted_files.txt | wc -l
grep ".pdf" deleted_files.txt | wc -l
grep ".xlsx" deleted_files.txt | wc -l

# Step 4: Get inode number of specific deleted file
fls -o 2048 suspect_image.dd | grep "secret_contract.docx"

# Step 5: Extract using icat (assuming inode 54321)
icat -o 2048 suspect_image.dd 54321 > recovered_secret_contract.docx

# Step 6: Verify recovery
file recovered_secret_contract.docx
md5sum recovered_secret_contract.docx

# Step 7: Extract all deleted documents in batch
for inode in $(grep ".docx" deleted_files.txt | awk '{print $1}'); do
    icat -o 2048 suspect_image.dd $inode > "recovered_$inode.docx"
done
Example 2: Timeline Analysis for Incident Response
# Scenario: Determine what happened during ransomware attack

# Step 1: Create body file for entire image
fls -r -m / -o 2048 suspect_image.dd > bodyfile.txt

# Step 2: Generate timeline for incident period (Jan 15-20, 2024)
mactime -b bodyfile.txt -d -h 2024-01-15..2024-01-20 > incident_timeline.csv

# Step 3: Filter for executable files (malware indicators)
grep ".exe" incident_timeline.csv > exe_activity.csv
grep ".dll" incident_timeline.csv > dll_activity.csv

# Step 4: Filter for file creations during incident (new files)
grep "m...c" incident_timeline.csv > creations.csv

# Step 5: Identify files modified during incident window
grep "m...m" incident_timeline.csv > modifications.csv

# Step 6: Sort by time to create chronological narrative
sort -k2 incident_timeline.csv > sorted_incident_timeline.csv

# Step 7: Look for suspicious patterns
cat sorted_incident_timeline.csv | grep -E "\.exe|\.dll|\.ps1|\.vbs"

# Step 8: Extract files created just before incident
head -50 sorted_incident_timeline.csv | grep "\.exe"
Example 3: Malware Artifact Hunting
# Scenario: System infected with unknown malware

# Step 1: Search for suspicious file names (common malware names)
fls -r image.dd | grep -i -E "(virus|malware|backdoor|trojan|keylog|ransom|crypt)"

# Step 2: Find recently created executable files
fls -r -l image.dd | grep "\.exe" | grep "2024-01"

# Step 3: Extract files modified during attack window (from timeline)
mactime -b bodyfile.txt -d | grep "2024-01-15 14:00:00..2024-01-15 16:00:00" > attack_window.txt
grep "\.exe" attack_window.txt > suspicious_executables.txt

# Step 4: Check Windows prefetch files (execution evidence)
fls -r image.dd | grep ".pf" > prefetch_files.txt

# Step 5: Extract and analyze suspicious executables
icat image.dd 98765 > suspect.exe
strings suspect.exe | grep -i "http" > network_indicators.txt
strings suspect.exe | grep -i "registry" > persistence_indicators.txt

# Step 6: Calculate hash of suspicious file
sha256sum suspect.exe > suspect_hash.txt

# Step 7: Check hash against VirusTotal (requires internet)
# Copy hash to virustotal.com for detection rates
Example 4: USB Device Data Exfiltration Investigation
# Scenario: Sensitive data copied to USB drive

# Step 1: Identify USB devices from registry
# In Autopsy: Navigate to SYSTEM hive → USBSTOR
# Or use TSK commands on extracted registry

# Step 2: List all files accessed during USB connection period
mactime -b bodyfile.txt -d -h 2024-01-15..2024-01-16 > usb_timeline.csv

# Step 3: Search for files on USB drive (common drive letters)
grep -E "E:|F:|G:|H:" usb_timeline.csv > usb_files.csv

# Step 4: Look for sensitive file types copied
grep -E "\.docx|\.xlsx|\.pdf|\.zip" usb_files.csv > exfiltrated_files.csv

# Step 5: Extract file access times to determine copy time
grep "2024-01-15" exfiltrated_files.csv > exfil_timing.csv

# Step 6: Cross-reference with user login times
# Check event logs or Security registry for logon events
Example 5: Browser Forensics (Web Activity)
# Scenario: User accessed malicious websites

# Step 1: Locate browser history files in evidence
fls -r image.dd | grep -i "history"
fls -r image.dd | grep -i "places.sqlite"     # Firefox
fls -r image.dd | grep -i "history.db"        # Safari
fls -r image.dd | grep -i "History"           # Chrome/Edge

# Step 2: Extract history files
icat image.dd inode_history > history_file

# Step 3: Search for suspicious URLs in extracted history
strings history_file | grep -i "http" | grep -i -E "malware|phishing|torrent|hack"

# Step 4: Extract download history
fls -r image.dd | grep -i "downloads"
strings downloads_file | grep -i "\.exe|\.zip|\.rar"

# Step 5: Check for cleared browser history (evidence tampering)
# Look for empty history files or recent deletion timestamps
📄 Report Generation Guide
Using Autopsy GUI Report
- Click "Generate Report" button in toolbar (top right)
- Select Report Type:
- HTML Report - Web-based, shareable, hyperlinked navigation (best for review)
- Excel Report - Spreadsheet format for data analysis (best for large datasets)
- PDF Report - Formal documentation for court (recommended for submission)
- Body File - For further TSK processing (advanced users)
- CSV Report - Machine-readable for scripting
- Select content to include (check boxes):
- ✓ Case information (case name, number, examiner)
- ✓ Evidence description (source, hash values, size)
- ✓ File system listing (directory tree)
- ✓ Deleted files (recoverable files)
- ✓ Tagged items (bookmarked evidence)
- ✓ Keyword search results (hits with context)
- ✓ Timeline data (chronological events)
- ✓ Hash matches (known bad files)
- ✓ Registry artifacts (extracted values)
- ✓ Email artifacts (parsed emails)
- ✓ Web artifacts (browser history)
- Choose output format options:
- Include file hashes (MD5/SHA256) - recommended for court
- Include hex previews (for suspicious files)
- Include timeline charts (visual representation)
- Maximum file size for inclusion (avoid huge reports)
- Click "Generate Report" (processing time depends on selected content)
- Preview report before saving (verify completeness)
- Save report to external media (not on same drive as evidence)
- Calculate hash of report file for chain of custody
Generating Reports from Command Line
# Generate file listing report (simple)
fls -r image.dd > file_listing_report.txt

# Generate hash report for all files in evidence
find /mnt/evidence -type f -exec md5sum {} \; > hash_report.txt

# Generate detailed timeline report
mactime -b bodyfile.txt -d > timeline_report.csv

# Generate metadata report for specific inodes
istat image.dd 12345 >> metadata_report.txt
istat image.dd 67890 >> metadata_report.txt

# Generate report of deleted files only
fls -d -r image.dd > deleted_files_report.txt

# Combine multiple reports into a single document
cat file_listing_report.txt timeline_report.csv > final_report.txt

# Generate report with specific date range (incident period)
mactime -b bodyfile.txt -d -h 2024-01-15..2024-01-20 > incident_report.csv
Report Best Practices for Court
- Include hash values - MD5/SHA256 for all extracted files and reports
- Document chain of custody - Include case number, examiner, dates, times
- Use PDF format - PDF is tamper-evident and widely accepted in court
- Include timeline charts - Visual representation helps judges/juries understand
- Tag critical evidence - Use "Notable" or "Suspicious" tags for key findings
- Add examiner notes - Explain methodology, assumptions, limitations
- Peer review - Have another examiner verify report before submission
- Preserve raw data - Keep original CSV exports for cross-examination
⚠️ Troubleshooting Common Issues
| Issue | Possible Cause | Solution |
|---|---|---|
| Autopsy won't start (Windows) | Java not installed, port conflict, corrupt installation | Install Java JDK 11+; change port: autopsy --port 9998; reinstall |
| Cannot find deleted files | File system overwritten, TRIM enabled (SSD), files deleted long ago | Use fls -d specifically; check unallocated space with dls; note SSD limitations |
| Timeline empty or incomplete | Wrong partition offset, no body file, incorrect date range | Run mmls to find correct offset; regenerate body file; expand date range |
| Keyword search slow or no results | Large evidence file (500GB+), no indexing, wrong encoding | Enable indexing first; search specific file types; try different encoding (UTF-8, ASCII) |
| Hash database not found | NSRL not downloaded, incorrect path, corrupt database | Download NSRL from https://www.nsrl.nist.gov; use custom hash set; verify path |
| Cannot open E01 image | Corrupted image, password protected, unsupported version | Verify image hash; use ewfmount to mount; convert to RAW with FTK Imager |
| Autopsy web interface not loading (Linux) | Port blocked, service not running, firewall | Check service: sudo systemctl status autopsy; open port 9999; restart service |
| File carving produces no results | Wrong signatures, files overwritten, unsupported file types | Update foremost/scalpel config files; carve from unallocated space only; add custom signatures |
🚀 Advanced Autopsy Features
🔌 Installing and Using Plugins
- Download plugins from
https://github.com/sleuthkit/autopsy-addon-modules - Copy
.nbmfiles toC:\Program Files\Autopsy\plugins\(Windows) or/usr/share/autopsy/plugins/(Linux) - Restart Autopsy to load plugins
- Enable plugins in Tools → Plugins (check boxes)
- Popular plugins for forensic analysis:
- STIX Exporter - Export findings in STIX format for threat intelligence
- VirusTotal Lookup - Automatically check files against VirusTotal (requires API key)
- PhotoDNA - Image hash matching for CSAM detection (law enforcement only)
- YARA Scanner - Malware signature scanning across evidence
- Elasticsearch Integration - Index evidence in Elasticsearch for large cases
- Encrypted Volume Detection - Identify BitLocker, TrueCrypt, VeraCrypt volumes
- Configure plugin settings in Tools → Plugin Options
🤖 Automating with Python (PyTSK)
# Install PyTSK (Python bindings for The Sleuth Kit)
pip install pytsk3

# Python script to automate file system analysis
import pytsk3
import sys

def analyze_image(image_path):
    """
    Automate forensic analysis of disk image
    """
    # Open the image
    img = pytsk3.Img_Info(image_path)
    fs = pytsk3.FS_Info(img)

    results = {
        'total_files': 0,
        'total_directories': 0,
        'deleted_files': 0,
        'file_types': {},
        'suspicious_files': []
    }

    # Define suspicious file patterns
    suspicious_patterns = ['password', 'confidential', 'secret', 'virus', 'malware']

    # Recursively traverse directory
    def traverse_dir(directory):
        try:
            for entry in fs.open_dir(path=directory):
                results['total_files' if entry.info.meta.type == pytsk3.TSK_FS_META_TYPE_REG else 'total_directories'] += 1

                # Check if file is deleted
                if entry.info.meta.flags & pytsk3.TSK_FS_META_FLAG_UNALLOC:
                    results['deleted_files'] += 1

                # Track file types by extension
                name = entry.info.name.name.decode('utf-8', errors='ignore')
                if '.' in name:
                    ext = name.split('.')[-1].lower()
                    results['file_types'][ext] = results['file_types'].get(ext, 0) + 1

                # Check for suspicious file names
                for pattern in suspicious_patterns:
                    if pattern in name.lower():
                        results['suspicious_files'].append({
                            'name': name,
                            'path': directory,
                            'deleted': bool(entry.info.meta.flags & pytsk3.TSK_FS_META_FLAG_UNALLOC)
                        })

                # Recursively traverse subdirectories
                if entry.info.meta.type == pytsk3.TSK_FS_META_TYPE_DIR:
                    sub_path = f"{directory}/{name}" if directory != "/" else f"/{name}"
                    traverse_dir(sub_path)
        except Exception as e:
            print(f"Error accessing {directory}: {e}")

    # Start traversal from root
    traverse_dir("/")

    return results

# Run analysis
if __name__ == "__main__":
    if len(sys.argv) != 2:
        print("Usage: python analyze.py ")
        sys.exit(1)

    image_path = sys.argv[1]
    results = analyze_image(image_path)

    print(f"Total files: {results['total_files']}")
    print(f"Total directories: {results['total_directories']}")
    print(f"Deleted files: {results['deleted_files']}")
    print(f"\nFile types found:")
    for ext, count in sorted(results['file_types'].items(), key=lambda x: x[1], reverse=True)[:10]:
        print(f"  .{ext}: {count}")
    print(f"\nSuspicious files found: {len(results['suspicious_files'])}")
    for f in results['suspicious_files']:
        print(f"  {f['path']}/{f['name']} (Deleted: {f['deleted']})")
🔗 Integrating with Other Forensic Tools
- Volatility - Memory analysis integration; import Volatility output into Autopsy case
- Wireshark - Network capture analysis; correlate PCAP with timeline
- Plaso (log2timeline) - Advanced timeline creation; import Plaso output as timeline
- Elasticsearch - Centralized log and artifact storage for large enterprise cases
- RegRipper - Registry analysis; import RegRipper output as artifact
- VirusTotal - Malware detection; API integration for hash lookup
- YARA - Malware signature scanning; run YARA rules within Autopsy
⚡ Performance Optimization Tips
- Use SSD for case files - Autopsy performs significantly faster on SSD (3-5x faster than HDD)
- Increase Java heap size - Edit
autopsy.confto increase memory:JAVA_OPTS="-Xmx8G" - Use file type filters - Exclude system files (.dll, .sys) from indexing to reduce time
- Process overnight - Schedule large ingest jobs (1TB+) to run overnight
- Use hash databases - Exclude known good files (Windows, Office) to reduce analysis time by 50%
- Disable unnecessary modules - Skip PhotoRec carving if not needed (very slow)
- Run on dedicated forensic workstation - Minimum 16GB RAM, multi-core CPU
- Use command-line tools for specific tasks - TSK commands are faster than GUI for single tasks
📋 Forensic Best Practices
- Always work on forensic image copies - Never analyze original evidence directly
- Document every step - Maintain detailed case notes with timestamps
- Hash verification - Verify MD5/SHA256 of evidence before and after analysis
- Use hardware write-blockers - Prevent accidental modification when accessing live drives
- Maintain chain of custody - Document every transfer, access, and analysis step
- Validate findings - Cross-reference with multiple tools (e.g., Autopsy + X-Ways)
- Time synchronization - Ensure accurate timestamp interpretation (UTC vs local)
- Peer review critical findings - Have another examiner verify important evidence
- Export evidence to external media - Never save extracted files to case folder (preserve integrity)
- Document authority - Record legal authority for examination (warrant, consent, subpoena)
- Preserve raw output - Keep original TSK command output for court production
- Update Autopsy regularly - New versions add file systems, plugins, and bug fixes
Autopsy and The Sleuth Kit should only be used on evidence you have legal authority to examine. Unauthorized forensic analysis may violate privacy laws (GDPR, CCPA, HIPAA, CFAA) and evidence handling regulations. Always obtain proper written authorization, consult with legal counsel, and maintain detailed chain of custody documentation.
Tool 2: OSForensics – Comprehensive Forensic Analysis Platform
OSForensics is a commercial forensic tool for rapid file system analysis, memory forensics, and artifact extraction. It is designed for speed and ease of use, making it ideal for both beginners and experienced forensic examiners.
- Fast file indexing and searching (millions of files in minutes)
- Memory forensics integration with Volatility
- Email and registry analysis with built-in viewers
- Thumbnail database viewer for Windows thumbcache
- Built-in password cracking (dictionary, brute-force, mask attacks)
- Live system analysis for incident response
- Hash database support (NSRL, custom hash sets)
- Timeline reconstruction with filtering
- File carving and data recovery
- Command-line tools for automation
📥 Complete Step-by-Step Installation Guide
1️⃣ System Requirements Check
| Component | Minimum | Recommended |
|---|---|---|
| OS | Windows 10/11, Windows Server 2016/2019/2022 | Windows 10/11 Pro or Enterprise (64-bit) |
| Processor | Intel Core i5 or better | Intel Core i7/i9 or Xeon (8+ cores) |
| RAM | 8GB minimum | 16GB-32GB (for large cases over 500GB) |
| Storage | 500MB for application + space for evidence | 1-2TB SSD for OS + separate NVMe for evidence |
| .NET Framework | Version 4.8 or later | Version 4.8 or later |
2️⃣ Download OSForensics
# Official download URL
https://www.osforensics.com/download.html

# Choose version:
- Free Trial (30 days, full features, no credit card required)
- Commercial License (perpetual or subscription)
- Lab License (multiple workstations, volume pricing)

# Trial limitations:
- Full features for 30 days
- No watermark on reports during trial
- Export and saving fully functional
3️⃣ Installation Steps
- Run the installer as Administrator (
OSForensicsSetup.exe) - Click "Next" on welcome screen
- Accept the license agreement and click Next
- Select installation directory (default:
C:\Program Files\OSForensics) - Select components:
- ✓ OSForensics Core Application (required)
- ✓ OSForensics Live CD Builder (optional - for bootable forensic media)
- ✓ Command-line tools (recommended for automation)
- ✓ Sample cases (optional - for training)
- Choose Start Menu folder (default: OSForensics)
- Select additional tasks:
- Create desktop shortcut (recommended)
- Associate .osf case files (recommended)
- Click "Install" and wait for completion (2-3 minutes)
- Click "Finish" to launch OSForensics
4️⃣ License Activation
- Upon first launch, click "Activate License"
- Enter License Key (provided after purchase)
- For trial, click "Start Trial" (30 days remaining)
- Click "Activate" to complete
- Verify activation: Help → About → License Status
5️⃣ Verify Installation
# Check version
Help → About OSForensics → Version should display (e.g., 8.5.0.0)

# Verify required tools
Tools → Options → Check that all paths are valid

# Test basic functionality
File → New Case → Enter test case → Create → Should create without errors📂 Step-by-Step: Creating a New Forensic Case
1️⃣ Create New Case
- Launch OSForensics from Start Menu or Desktop
- Click "File" → "New Case" or press Ctrl+N
- Enter Case Name (e.g., "Corporate_Data_Breach_2024")
- Enter Case Number (e.g., "CASE-2024-001")
- Select Case Directory (external drive recommended - not C: drive)
- Enter Examiner Name and Organization
- Add Case Notes (description of investigation, legal authority)
- Click "Create Case" to create case folder structure
2️⃣ Add Evidence Sources
- Click "Add Evidence" or "File" → "Add Evidence"
- Select Evidence Type:
- Physical Drive - Entire hard disk (requires write-blocker)
- Logical Drive - Specific partition or volume
- Image File - Forensic images (E01, DD, RAW, AFF, VMDK, VHD, VHDX)
- Folder - Directory on mounted drive
- Memory Dump - RAM capture files (.raw, .mem, .dmp)
- Cloud Evidence - Office 365, Google Workspace (with credentials)
- Browse and select the evidence source
- Configure time zone for accurate timestamp display (UTC vs Local)
- Click "Add" to import evidence
- Verify evidence hash (MD5/SHA1/SHA256) matches original
3️⃣ Indexing and Processing
- Select "Index Evidence" from the toolbar
- Choose Indexing Options:
- Quick Index - Fast, basic file listing (minutes)
- Full Index - Complete content indexing (hours, but thorough)
- Custom Index - Select specific file types or folders
- No Index - Browse without indexing (slower searching)
- Select Hash Database (NSRL or custom hash set for known files)
- Configure File Filters:
- Include/Exclude file extensions
- Minimum/Maximum file size
- Date range filters
- Click "Start Indexing"
- Monitor progress in status bar (time remaining displayed)
- When complete, click "OK" to begin analysis
🧭 Navigating the OSForensics Interface
Main Dashboard Components
- Case Explorer (Left Panel) - Evidence tree, file system navigation, bookmarks
- Content Viewer (Center Panel) - File preview, hex view, text view, image view
- Results Panel (Bottom) - Search results, bookmarks, tags, hash matches
- Toolbar (Top) - Quick access to search, indexing, reports, tools
- Status Bar (Bottom) - Indexing progress, case information, file count
📊 Key Analysis Views
| View | Description | Access Method | Best For |
|---|---|---|---|
| File Browser | Navigate file system hierarchy with icons | Case Explorer → Evidence → File System | Browsing folder structure, locating specific files |
| File Types | Group files by extension and MIME type | View → File Types | Finding all images, documents, or executables |
| Deleted Files | List recoverable deleted files (red X icon) | View → Deleted Files | Recovering recently deleted evidence |
| Timeline | Chronological event view (MACB times) | View → Timeline | Reconstructing user activity during incident |
| Hash Set Manager | Manage known file hashes (good/bad) | Tools → Hash Set Manager | Filtering known system files, identifying malware |
| Bookmarks | Saved interesting artifacts | View → Bookmarks | Collecting evidence for report |
🔧 Detailed Feature Guide
🔍 Feature 1: File Search and Indexing
- Click "Search" tab in the toolbar
- Enter search terms (supports Boolean: AND, OR, NOT, wildcards: *, ?)
- Select search scope:
- File names only (fastest)
- File contents (slower but thorough)
- Both name and content (balanced)
- Apply advanced filters:
- File size range (e.g., 1KB to 10MB)
- Date modified/created/accessed (range or before/after)
- File extension (e.g., .docx, .pdf, .xlsx)
- Hash match status (known good/bad)
- Path includes/excludes
- Click "Search" to execute (progress bar shows completion)
- Review results in Results Panel (sortable columns)
- Double-click any result to preview content in Content Viewer
- Right-click results to bookmark, export, or compute hash
🗑️ Feature 2: Recovering Deleted Files
- Navigate to "View" → "Deleted Files"
- Review list of recoverable files (marked with red X icon)
- Sort by deletion date, size, or path for easier navigation
- Filter by file type, size range, or date deleted
- Preview files before recovery (double-click to see content)
- Select files to recover (check boxes or Select All)
- Click "Recover Selected"
- Choose destination folder (external drive recommended, NOT same drive)
- Verify recovered files with hash verification (MD5/SHA256)
- Document recovery in case notes
📅 Feature 3: Timeline Analysis
- Click "Timeline" tab or "View" → "Timeline"
- Select time range:
- Preset: Last hour/day/week/month/year
- Custom date range (e.g., incident period: Jan 15-20, 2024)
- All time (for complete history)
- Choose event types to display:
- File creation (C)
- File modification (M)
- File access (A)
- Metadata changes (B)
- Registry changes
- Event logs (requires processing)
- View timeline in list view (chronological table) or chart view (visual density)
- Filter by file path, extension, or size using filter bar
- Click any event to view details and preview file in Content Viewer
- Zoom in/out on chart view for different time granularities
- Export timeline as CSV, HTML, or PDF for report inclusion
🔐 Feature 4: Password Cracking
- Navigate to "Tools" → "Password Cracking"
- Select hash type or file type:
- NTLM (Windows passwords - from SAM hive)
- LM (Legacy Windows - weak, easily cracked)
- MD5, SHA1, SHA256, SHA512
- ZIP/RAR archives (password-protected)
- Microsoft Office documents (Word, Excel, PowerPoint)
- PDF files (user and owner passwords)
- BitLocker recovery passwords
- Load hash file or password-protected file from evidence
- Select attack mode:
- Dictionary Attack - Wordlist-based (fast, good for common passwords)
- Brute Force Attack - All character combinations (slow, but thorough)
- Mask Attack - Pattern-based (e.g., 8 letters + 2 numbers)
- Hybrid Attack - Dictionary with mutations (append/prepend numbers)
- Rule-based Attack - Apply transformation rules to wordlist
- Load or create wordlist:
- Built-in wordlists (common passwords, English words)
- Custom wordlist (e.g., rockyou.txt from Kali Linux)
- Generate from case keywords (Tools → Generate Wordlist)
- Configure rules (case transformations, character substitutions, appends)
- Set attack parameters:
- Minimum/Maximum password length (brute-force)
- Character set (lowercase, uppercase, numbers, symbols)
- Timeout limit (stop after X minutes)
- Click "Start Attack" and monitor progress
- View cracked passwords in results panel when found
- Export cracked hashes to CSV for documentation
📧 Feature 5: Email Analysis
- Navigate to "Tools" → "Email Analysis"
- Select email source:
- PST/OST files (Outlook - most common)
- MBOX files (Thunderbird, Apple Mail, Eudora)
- EML/MSG individual messages (exported emails)
- Live Exchange server (with proper credentials and authorization)
- Click "Load" and browse to select file(s)
- Review email list with columns:
- Sender (From address)
- Recipients (To, CC, BCC)
- Subject line
- Date and time sent/received
- Attachments (paperclip icon)
- Folder (Inbox, Sent, Deleted Items)
- Search emails by keyword, sender, recipient, date range, or subject
- View email content in preview pane (HTML or plain text)
- Extract attachments by right-clicking and selecting "Save Attachment"
- Export emails as PDF, HTML, EML, or MSG for evidence preservation
- Recover deleted emails (if PST is not compacted)
🖼️ Feature 6: Thumbnail Database Viewer
- Navigate to "Tools" → "Thumbnail Viewer"
- Select thumbnail database location:
- From live system:
C:\Users\[User]\AppData\Local\Microsoft\Windows\Explorer - From evidence image: Browse to same path in mounted evidence
- From live system:
- Load thumbcache_*.db files (thumbcache_256.db, thumbcache_1024.db, etc.)
- View extracted thumbnails in gallery view (grid of images)
- Filter by size, date, or hash to narrow results
- Sort by date modified to see most recent activity first
- Double-click thumbnail to view full-size image with metadata
- Export thumbnails as individual images or HTML report
- Forensic significance: Thumbnails prove user viewed images even if original files deleted
💾 Feature 7: Memory Forensics
- Navigate to "Tools" → "Memory Forensics"
- Load memory dump file (RAW, ELF, Mach-O, WinPmem formats)
- Select analysis profile (Windows version, Linux kernel, macOS version)
- Run analysis modules (check boxes):
- Process list (pslist) - Running processes and hidden processes
- Network connections (netscan) - Active connections and listening ports
- Loaded DLLs (dlllist) - Libraries loaded by each process
- Open files and handles (handles) - Files accessed by processes
- Registry in memory (hivelist) - Registry hives loaded in RAM
- Command history (cmdscan) - Commands typed in cmd/PowerShell
- Malware detection (malfind) - Injected code and process hollowing
- Click "Analyze" to run selected modules
- Review results in organized tabs (processes, network, etc.)
- Extract suspicious processes for further analysis (right-click → Dump Process)
- Generate memory forensics report (File → Export Report → PDF/HTML)
🖥️ Feature 8: Live System Analysis (Incident Response)
- Navigate to "Tools" → "Live System Analysis"
- Select target system:
- Local system (current computer)
- Remote system (requires admin credentials and network access)
- Choose data to collect (check boxes):
- Running processes (list of all processes with PIDs)
- Network connections (active TCP/UDP connections)
- Logged-in users (currently logged on users)
- Recent files (recently accessed documents)
- USB device history (from Registry)
- Browser history (Chrome, Firefox, Edge, IE)
- Event logs (Security, System, Application)
- Registry (selected hives or full export)
- Click "Collect" to gather data (1-5 minutes depending on options)
- Review collected artifacts in real-time as they appear
- Save collection as case evidence (OSForensics .osf format)
- Create live response report (HTML or PDF) for documentation
- Forensic note: Live analysis modifies system (registers changes). Document authority for live acquisition.
🔍 Feature 9: Hash Analysis and Known File Filtering
- Navigate to "Tools" → "Hash Set Manager"
- Load hash databases:
- NSRL (National Software Reference Library) - Known good files (Windows, Office)
- Custom Good Set - Organization-specific approved files
- Custom Bad Set - Known malware/hacker tool hashes
- Configure hash matching:
- Automatically flag known bad files (red alert)
- Exclude known good files from results (reduce noise)
- Calculate hashes for selected files (MD5, SHA1, SHA256)
- View hash matches in Results Panel under "Hash Matches" tab
- Export hash results for documentation
🎯 Practical Analysis Examples
Example 1: Finding Suspicious Documents
# Scenario: Locate confidential documents accessed during incident

# Step 1: Open Search tab
Click "Search" in toolbar

# Step 2: Enter search criteria
Content contains: "confidential" OR "internal use only" OR "proprietary"
File extensions: .docx, .pdf, .xlsx, .txt
Date modified: Last 30 days

# Step 3: Execute search
Click "Search" - results appear in bottom panel

# Step 4: Filter results
Click "File Types" filter → Select only Word and PDF documents

# Step 5: Review suspicious files
Double-click each result → View content in preview pane

# Step 6: Bookmark evidence
Right-click suspicious files → Add to Bookmark → Enter reason

# Step 7: Extract files
Select bookmarked files → Export → Choose external drive destination
Example 2: Timeline Reconstruction for Incident
# Scenario: Reconstruct attacker activity during incident window

# Step 1: Open Timeline view
View → Timeline

# Step 2: Set incident time window
Custom range: Jan 15, 2024 14:00:00 to Jan 15, 2024 18:00:00

# Step 3: Filter for relevant events
Event types: File creation, File modification, Registry changes

# Step 4: Sort chronologically
Click "Timestamp" column to sort oldest to newest

# Step 5: Identify attacker entry point
Look for first suspicious event (unusual file, registry change)

# Step 6: Track lateral movement
Look for network share access, new user accounts

# Step 7: Identify data exfiltration
Look for USB connections, file copies to external drives

# Step 8: Export timeline for report
File → Export → CSV format → Save to case folder
Example 3: Cracking Windows Password Hash
# Scenario: Extract and crack Windows local account password

# Step 1: Extract SAM and SYSTEM files from evidence
Navigate to C:\Windows\System32\config\ in evidence
Right-click SAM → Export → Save to case folder
Right-click SYSTEM → Export → Save to case folder

# Step 2: Load into Password Cracking tool
Tools → Password Cracking → Load hash file → Select SAM
Tools → Password Cracking → Load key file → Select SYSTEM (for decryption)

# Step 3: View extracted hashes
Hashes appear in left panel with usernames

# Step 4: Select dictionary attack
Attack Mode: Dictionary Attack
Wordlist: rockyou.txt (download from Kali or use built-in)

# Step 5: Apply rules for variations
Enable rules: Append numbers (password1, password123)
Enable rules: Common substitutions (p@ssw0rd for password)

# Step 6: Start attack
Click "Start Attack" → Monitor progress bar

# Step 7: View results when found
Cracked passwords appear in "Results" tab with username

# Step 8: Export cracked hashes
Click "Export Results" → CSV format → Save to case folder
Example 4: USB Device Data Exfiltration Investigation
# Scenario: Identify USB drive used to copy sensitive files

# Step 1: Open Registry Viewer
Navigate to C:\Windows\System32\config\SYSTEM → Double-click

# Step 2: Navigate to USBSTOR
HKLM\SYSTEM\CurrentControlSet\Enum\USBSTOR

# Step 3: Review USB devices
Note: Device description, serial number, Last Write Time (last connection)

# Step 4: Search for files accessed during USB connection
Search → Content contains sensitive keywords → Filter by date range matching USB connection

# Step 5: Check ShellBags for USB folder access
Load NTUSER.DAT of user → Navigate to Shell\BagMRU
Identify folders on USB drive (usually E:, F:, G:)

# Step 6: Extract accessed files
Navigate to identified folders → Select files → Export

# Step 7: Document evidence
Serial number of USB drive, connection times, files accessed
Example 5: Malware Persistence Detection
# Scenario: Identify malware that runs at startup

# Step 1: Load SOFTWARE hive
Navigate to C:\Windows\System32\config\SOFTWARE → Double-click

# Step 2: Check Run keys
Navigate to: Microsoft\Windows\CurrentVersion\Run
Note all entries with suspicious names or paths

# Step 3: Check user Run keys
Load each NTUSER.DAT → Same path under HKCU
Compare with system-wide entries

# Step 4: Check Services
Navigate to: HKLM\SYSTEM\CurrentControlSet\Services
Look for services with unusual ImagePath (Temp folder, User directory)

# Step 5: Check Scheduled Tasks
Navigate to: HKLM\SOFTWARE\Microsoft\Windows NT\CurrentVersion\Schedule\TaskCache\Tasks

# Step 6: Calculate hash of suspicious executables
Select file → Tools → Compute Hash → MD5/SHA256

# Step 7: Check hash against VirusTotal
Copy hash → Submit to virustotal.com (with internet access)

# Step 8: Document persistence mechanisms
List of Run keys, service names, scheduled tasks with timestamps
📄 Report Generation Guide
Creating a Forensic Report
- Click "File" → "Generate Report"
- Select Report Template:
- Standard Forensic Report - Complete case documentation (recommended for court)
- Executive Summary - High-level findings for management
- Technical Report - Detailed technical analysis for other examiners
- Custom Template - Create your own with logo and headers
- Select sections to include (check boxes):
- ✓ Case information and chain of custody
- ✓ Evidence description and hash values
- ✓ File system analysis results
- ✓ Deleted files recovered
- ✓ Keyword search hits
- ✓ Timeline events (with chart)
- ✓ Hash matches (known bad files)
- ✓ Registry artifacts extracted
- ✓ Email analysis findings
- ✓ Thumbnail gallery
- ✓ Memory forensics results
- ✓ Password cracking results
- ✓ Bookmarked evidence
- Choose output format:
- PDF - Recommended for court submission (read-only, tamper-evident)
- HTML - Web-based, shareable, hyperlinked navigation
- DOCX - Editable in Microsoft Word (for internal review)
- CSV - For data analysis in Excel (timelines, file lists)
- Add examiner notes and conclusions (free text field)
- Click "Generate" to create report (1-5 minutes depending on sections)
- Review report and click "Save Report" to external media
- Calculate hash of report file (MD5/SHA256) for chain of custody
⌨️ OSForensics Command Line Tools
Available CLI Tools
# osfindex.exe - Command line indexing (for automation)
osfindex.exe -case "C:\Cases\Case001" -evidence "E:\evidence.dd" -index full

# osfsearch.exe - Command line search (batch keyword searching)
osfsearch.exe -case "C:\Cases\Case001" -query "password" -output results.txt

# osfhash.exe - Generate hash sets from directory
osfhash.exe -dir "C:\Files" -output hashset.txt -algorithm md5

# osfrecover.exe - Recover deleted files by extension
osfrecover.exe -evidence "E:\evidence.dd" -output "C:\Recovered" -types .docx,.pdf,.xlsx

# osftimeline.exe - Generate timeline from case
osftimeline.exe -case "C:\Cases\Case001" -start "2024-01-15" -end "2024-01-20" -output timeline.csv

# osfpassword.exe - Password cracking from command line
osfpassword.exe -hashfile sam.txt -wordlist rockyou.txt -attack dictionary -output cracked.txt

# Batch processing example - Process multiple images
for %%i in (E:\Evidence\*.E01) do (
    osfindex.exe -case "C:\Cases\Batch" -evidence "%%i" -index quick
)
⚠️ Troubleshooting Common Issues
| Issue | Possible Cause | Solution |
|---|---|---|
| OSForensics won't launch | .NET Framework missing or corrupt | Install .NET Framework 4.8 or later; repair installation using Windows Features |
| Cannot open evidence image | Unsupported format or corrupted image | Verify image hash; convert to RAW using FTK Imager; try mounting with Arsenal Image Mounter |
| Indexing very slow | Large evidence (500GB+), insufficient RAM, HDD instead of SSD | Index overnight; add more RAM; move case to SSD; use file type filters to reduce scope |
| Password cracking fails | Weak wordlist, strong password, wrong hash type | Use larger wordlist (rockyou.txt, 10 million+); try brute force or mask attack; verify hash type |
| Memory forensics no output | Wrong profile, corrupted memory dump, unsupported OS version | Verify memory dump with Volatility CLI; select correct profile; check OS version compatibility |
| Cannot find deleted files | File system overwritten, TRIM enabled on SSD, files deleted long ago | Check unallocated space using file carving; carve by file signature; note that SSDs may have TRIM |
| Live analysis fails (remote) | Firewall blocking, Remote Registry service not running, insufficient privileges | Check firewall rules; start Remote Registry service; use domain admin credentials |
🚀 Advanced Features
🔌 OSForensics Scripting (PowerShell Integration)
# PowerShell script to automate OSForensics tasks
# Requires OSForensics command-line tools in PATH

$casePath = "C:\Cases\Incident_2024"
$evidenceFile = "E:\suspect_drive.dd"

Write-Host "Starting automated forensic analysis..." -ForegroundColor Green

# Step 1: Create new case directory
New-Item -ItemType Directory -Force -Path $casePath

# Step 2: Index evidence
& osfindex.exe -case $casePath -evidence $evidenceFile -index quick
Write-Host "Indexing complete" -ForegroundColor Yellow

# Step 3: Search for keywords
$keywords = @("password", "confidential", "secret", "SSN", "credit card", "proprietary")
foreach ($keyword in $keywords) {
    & osfsearch.exe -case $casePath -query $keyword -output "$casePath\results_$keyword.txt"
    Write-Host "Searched for: $keyword" -ForegroundColor Cyan
}

# Step 4: Generate timeline for incident window
& osftimeline.exe -case $casePath -start "2024-01-15" -end "2024-01-20" -output "$casePath\timeline.csv"

# Step 5: Recover deleted Office documents
& osfrecover.exe -evidence $evidenceFile -output "$casePath\Recovered" -types .docx,.xlsx,.pptx,.pdf

Write-Host "Analysis complete. Results saved to $casePath" -ForegroundColor Green
🔗 Integration with Other Forensic Tools
- FTK Imager - Create forensic images (E01, DD, RAW) for OSForensics
- Volatility - Enhanced memory analysis; export Volatility results as CSV and import to OSForensics
- Wireshark - Network capture correlation; import PCAP files and correlate with timeline
- Plaso (log2timeline) - Super timeline creation; import Plaso output into OSForensics timeline
- Elasticsearch - Centralized case data storage for large investigations
- X-Ways Forensics - Cross-validate findings between tools
📊 Performance Optimization Tips
- Use SSD storage - Store case files on SSD for faster indexing and searches (3-5x faster than HDD)
- 64-bit version - Always use 64-bit OSForensics for large evidence (>4GB)
- Increase RAM allocation - Tools → Options → Performance → Set maximum RAM usage
- Use hash databases - Exclude known good files (Windows, Office) to reduce indexing time by 50%
- Index overnight - Schedule large index jobs (1TB+) to run overnight
- File type filters - Index only relevant file types (documents, images) to reduce scope
- Disable unnecessary modules - Skip email analysis if not needed for case
🛡️ Case Encryption and Security
# Encrypt case files to protect sensitive evidence
Tools → Case Encryption → Enable Encryption → Set strong password

# Password requirements:
- Minimum 12 characters
- Mix of uppercase, lowercase, numbers, symbols
- Do not reuse passwords across cases

# Export encrypted case
File → Export Case → Encrypted format → Requires password to open

# Forensic note: Document encryption password in secure location (separate from evidence)
📋 Forensic Best Practices with OSForensics
- Always use hardware write-blocker when accessing live drives - prevents accidental modification
- Verify hash values before and after analysis (MD5/SHA256) - document in case notes
- Document all actions in case notes for chain of custody - each step, timestamp, reason
- Export evidence to external media, NOT case directory - preserve original evidence
- Validate findings with a second forensic tool (X-Ways, Autopsy) - cross-verification
- Update OSForensics regularly for new features and bug fixes - Check Help → Check for Updates
- Back up case files to secure, encrypted storage - daily backups during active case
- Use strong passwords for case encryption (Tools → Case Encryption) - 12+ characters
- Document authority - Record legal authority for examination (warrant, consent, subpoena)
- Time zone consistency - Note UTC vs local time conversion in reports
- Peer review - Have another examiner review critical findings
- Maintain software logs - Export OSForensics processing logs for audit trail
📋 Quick Reference Card
- Create new case (File → New Case)
- Add evidence (File → Add Evidence)
- Index evidence for searching (Index Evidence)
- Search for keywords (Search tab)
- Recover deleted files (View → Deleted Files)
- Analyze timeline (View → Timeline)
- Examine registry (navigate to registry hives)
- Review email (Tools → Email Analysis)
- Crack passwords if needed (Tools → Password Cracking)
- Bookmark evidence (Right-click → Add to Bookmark)
- Generate report (File → Generate Report)
Ctrl+N - New Case
Ctrl+O - Open Case
Ctrl+A - Add Evidence
Ctrl+F - Search
Ctrl+B - Bookmarks
Ctrl+R - Generate Report
Ctrl+E - Export Selected
F5 - Refresh
Delete - Remove from listOSForensics should only be used on evidence you have legal authority to examine. Unauthorized forensic analysis may violate privacy laws (GDPR, CCPA, HIPAA) and evidence handling regulations. Always maintain proper chain of custody documentation, obtain written authorization, and consult with legal counsel before beginning examination.
Tool 3: X-Ways Forensics – Professional Analysis Platform
X-Ways Forensics is a commercial forensic platform known for its exceptional speed, low resource usage, and advanced analysis capabilities. It is widely used by government agencies, law enforcement, and corporate investigators worldwide as a cost-effective alternative to more expensive suites.
- Extremely fast processing (often 2-3x faster than competitors)
- Low memory and CPU usage (runs efficiently on modest hardware)
- Built-in disk cloning and imaging capabilities
- Advanced file carving and signature analysis
- Registry viewer and analysis with transaction log support
- Timeline reconstruction with filtering
- Data recovery from formatted or damaged drives
- Native support for E01, DD, VMDK, VHD, and RAW images
- Scriptable automation via X-Script
- Case management and reporting
📥 Complete Installation Guide
Step 1: System Requirements
| Component | Minimum | Recommended |
|---|---|---|
| OS | Windows 10/11, Windows Server 2016+ | Windows 10/11 Pro or Enterprise |
| Processor | Intel Core i5 (2.5 GHz) | Intel Core i7/i9 or Xeon (3.0 GHz+) |
| RAM | 8 GB | 16-32 GB (for large cases) |
| Storage | 100 GB available | 1-2 TB SSD + separate evidence drive |
| Display | 1280 x 1024 | 1920 x 1080 or higher (dual monitors recommended) |
Step 2: Download X-Ways Forensics
# Official website (trial available)
https://www.x-ways.net/forensics/

# Download options:
- xwforensics64.zip (64-bit version - recommended)
- xwforensics.zip (32-bit version)
- xwforensics_linux.zip (Linux version via Wine)

# License types:
- Single user license (perpetual, includes 1 year updates)
- Site license (multiple workstations)
- Government/Educational discounts available
Step 3: Extract and Install
# X-Ways Forensics is portable - no installer required
# Step 1: Extract ZIP archive to desired location
Extract to C:\X-Ways Forensics\

# Step 2: Recommended folder structure
C:\X-Ways Forensics\
├── xwforensics64.exe    (main executable)
├── xwforensics.chm      (help file)
├── Plugins\             (custom plugins)
├── Scripts\             (X-Script automation)
└── Cases\               (case files)

# Step 3: Launch X-Ways Forensics
Double-click xwforensics64.exe

# Step 4: Enter license key on first run (or start trial)
File → Register → Enter license key🚀 First Steps - Creating a Case
Step 1: Create New Case
- Launch xwforensics64.exe
- Click "File" → "New" or press Ctrl+N
- Enter Case Name (e.g., "Corporate_Investigation_2024")
- Enter Case Number (e.g., "INV-2024-001")
- Select Case Directory (external drive recommended)
- Enter Examiner Name and Organization
- Add Case Notes (optional but recommended)
- Click "OK" to create case
Step 2: Add Evidence Source
- Click "File" → "Add Evidence" or Ctrl+A
- Select Evidence Type:
- Physical Drive - Entire hard disk (requires write-blocker)
- Logical Drive - Specific partition or volume
- Image File - E01, DD, RAW, VMDK, VHD, AFF
- Folder - Directory on mounted drive
- Remote Drive - Network evidence (with permissions)
- Browse and select the evidence source
- Configure time zone for accurate timestamp display
- Click "OK" to add evidence
🖥️ X-Ways Forensics Interface Overview
Main Window Components
- Directory Browser (Left Panel) - File system hierarchy
- File List (Top Right) - Files in selected directory
- Hex Viewer (Bottom Right) - Raw data and hex dump
- Detail Panel (Right) - File metadata, timestamps, hashes
- Toolbar (Top) - Quick access to analysis tools
- Status Bar (Bottom) - Current operation status
Navigation Tips
- F2 - Rename selected item
- F5 - Refresh view
- Ctrl+F - Find files or text
- Ctrl+H - Toggle hex viewer
- Ctrl+Shift+T - Show timeline
- Space - Quick view selected file
🔧 Key Features & Analysis Techniques
1️⃣ Disk Imaging and Cloning
# Create forensic image of a drive
Tools → Copy/Restore Disk → Select source drive → Select destination → Start

# Supported output formats:
- E01 (Encase format with compression)
- DD/RAW (bit-for-bit image)
- VHD/VHDX (virtual hard disk)
- AFF (Advanced Forensic Format)

# Features:
- Hardware write-blocker support
- Compression (levels 1-9)
- Split image into segments (e.g., 2GB parts)
- Verify image with hash calculation
2️⃣ File Carving (Data Recovery)
# Carve deleted files from unallocated space
Specialist → File Carving by Type

# Select file types to carve:
- Documents (PDF, DOC, XLS, PPT)
- Images (JPG, PNG, GIF, BMP)
- Archives (ZIP, RAR, 7Z)
- Emails (PST, EML, MSG)

# Configure carving options:
- Minimum file size (avoid false positives)
- Maximum file size
- Carve from specific sectors
- Signature validation strength

# Review carved files
Files appear in "Carved Files" virtual directory
3️⃣ Registry Analysis
# Load registry hive
Navigate to C:\Windows\System32\config\SYSTEM
Double-click to open Registry Viewer

# Registry Viewer features:
- Parse transaction logs (for corrupted hives)
- View Last Write Times
- Export values as CSV
- Search across all hives
- Compare registry snapshots

# Key registry artifacts to examine:
- USBSTOR (USB device history)
- UserAssist (program execution)
- Run keys (persistence)
- SAM (user accounts with SYSTEM)
4️⃣ Timeline Analysis
# Generate timeline of all file activity
Timeline → Create Timeline

# Configure timeline options:
- Include deleted files
- Include file system metadata (MACB times)
- Include registry events
- Include event logs

# View timeline:
- List view (chronological event list)
- Chart view (visual density timeline)
- Filter by date range
- Filter by event type (created, modified, accessed)

# Export timeline
File → Export → CSV → Save
5️⃣ Hash Analysis and Filtering
# Calculate file hashes
Select files → Tools → Compute Hash → MD5/SHA1/SHA256

# Create hash set (known good files)
Specialist → Create Hash Set → Select known good files → Save

# Hash database integration:
- NSRL (National Software Reference Library)
- Custom hash sets (known bad/malicious files)
- Alert on hash matches (file identification)

# Filter by hash:
View → Filter → Hash → Known Good / Known Bad
6️⃣ Email Analysis
# Parse email files
Navigate to .PST, .OST, .EML, .MSG files
Double-click to open Email Viewer

# Email Viewer features:
- View sender, recipients, subject, date
- View email body (HTML/Plain text)
- Extract attachments
- Search across emails
- Export emails as EML or PDF

# Recover deleted emails
Carve from unallocated space using file carving
7️⃣ Picture Gallery and EXIF Analysis
# View all images in case
Specialist → Picture Gallery

# Features:
- Thumbnail preview of all images
- EXIF metadata extraction (GPS, camera, date)
- Filter by dimensions, format, date
- Extract embedded thumbnails
- Geotag mapping

# Export images
Select images → File → Export → Choose destination
8️⃣ Hex Viewer and Low-Level Analysis
# Open file in hex viewer
Select file → Press F3 or double-click hex panel

# Hex Viewer features:
- Multiple views: Hex, Decode, Text, EBCDIC
- Search for hex patterns
- Interpret data as structures (DOS, PE, ELF)
- Decode timestamps (Windows, Unix)
- View file signatures (magic bytes)
- Extract data ranges
🎯 Practical Forensic Use Cases
Use Case 1: Data Exfiltration Investigation
# Scenario: Employee suspected of copying sensitive data to USB

# Step 1: Create case and add forensic image
File → New → Corporate_Investigation
File → Add Evidence → Image File → Select suspect drive image

# Step 2: Identify USB devices from registry
Navigate to C:\Windows\System32\config\SYSTEM
Open Registry Viewer → HKLM\SYSTEM\CurrentControlSet\Enum\USBSTOR
Export USB device list with timestamps

# Step 3: Search for sensitive keywords
Specialist → Indexing/Search → Enter keywords
Keywords: "confidential", "HR", "financial", "client list", "salary"

# Step 4: Check ShellBags for USB folder access
Navigate to each user's NTUSER.DAT
Open Registry Viewer → Explorer\Shell\BagMRU
Identify folders accessed on USB drives

# Step 5: Extract files accessed during incident window
Timeline → Create Timeline → Filter by date range
Export relevant files for evidence

# Step 6: Generate report
Report → Create Report → Include USB devices, keyword hits, timeline
Use Case 2: Malware Investigation and Analysis
# Scenario: Suspicious system behavior, possible malware infection

# Step 1: Create case and add memory dump and disk image
File → New → Malware_Investigation
File → Add Evidence → Memory Dump (optional)
File → Add Evidence → Disk Image

# Step 2: Search for known malware indicators
Specialist → Indexing/Search → Enter known malware hashes
Specialist → Indexing/Search → Enter registry key names
Specialist → Indexing/Search → Enter file names

# Step 3: Check auto-start locations
Navigate to Run registry keys:
- HKLM\SOFTWARE\Microsoft\Windows\CurrentVersion\Run
- HKCU\SOFTWARE\Microsoft\Windows\CurrentVersion\Run
- C:\ProgramData\Microsoft\Windows\Start Menu\Programs\Startup

# Step 4: Analyze UserAssist for program execution
Load each user's NTUSER.DAT
Navigate to Explorer\UserAssist
Review executed programs and counts

# Step 5: Extract suspicious files
Select suspicious files → File → Export → Save to case folder
Submit to VirusTotal for analysis

# Step 6: Carve deleted malware files
Specialist → File Carving by Type → Select PE/EXE files
Review carved executables for malware
Use Case 3: Timeline Reconstruction for Incident Response
# Scenario: Need to reconstruct attacker activity timeline

# Step 1: Create timeline from all evidence
Timeline → Create Timeline
Select: Include file system, registry, event logs

# Step 2: Filter timeline to incident window
Timeline → Filter → Date range (e.g., Jan 15-20, 2024)

# Step 3: Identify attacker entry point
Look for:
- First suspicious process creation (Event ID 4688)
- First registry modification (malware persistence)
- File downloads (Downloads folder, Temp)

# Step 4: Track lateral movement
Check for:
- Network share access (Registry: Map Network Drive MRU)
- RDP connections (Registry: Terminal Server Client)
- New user accounts (Registry: SAM)

# Step 5: Identify data exfiltration
Look for:
- USB device connections (Registry: USBSTOR)
- File access on USB drives (ShellBags)
- Email attachments sent (PST files)
- Cloud uploads (browser history, OneDrive)

# Step 6: Export timeline for report
Timeline → Export → CSV → Save
Include timeline chart in forensic report
Use Case 4: Deleted File Recovery
# Scenario: Important files were deleted and need recovery

# Step 1: Locate deleted files
View → Show Deleted Files (check)
Deleted files appear with [Deleted] prefix

# Step 2: Search for specific deleted files
Ctrl+F → Search for filename pattern
Include "Deleted files" in search scope

# Step 3: Recover deleted files
Select deleted file → Right-click → Recover/Copy → Choose destination

# Step 4: Carve files if metadata is missing
Specialist → File Carving by Type → Select file types
Review carved results in "Carved Files" folder

# Step 5: Analyze unallocated space
Specialist → View Unallocated Space → Search for file signatures

# Step 6: Document recovery
Note: File name, recovery method, confidence level
Use Case 5: Cross-Drive Analysis (Lateral Movement)
# Scenario: Attacker moved across multiple systems

# Step 1: Add multiple forensic images to same case
File → Add Evidence → Add second drive image

# Step 2: Identify common artifacts
Specialist → Find Duplicate Files → Compare across drives
Look for same file on multiple systems

# Step 3: Track user accounts
Load SAM hives from each system
Compare user accounts, last login times, passwords

# Step 4: Analyze network artifacts
Check each system for:
- Mapped drives to other systems
- RDP connections to other systems
- PSExec/SMB logins

# Step 5: Build cross-system timeline
Export timeline from each system
Merge timelines in Timeline Explorer
Identify sequence of compromise
🤖 X-Script Automation
Introduction to X-Script
X-Script is X-Ways Forensics' built-in scripting language for automating repetitive tasks and batch processing.
Basic X-Script Example
# Example: Automated hash calculation and export
# Save as .xss file

# Open case
OpenCase "C:\Cases\Investigation"

# Add evidence image
AddImage "E:\Evidence\suspect_drive.E01"

# Calculate hashes for all files
SelectAllFiles
ComputeHash "MD5"

# Export file list with hashes
ExportFileList "C:\Output\file_list.csv" "Name,Path,Size,MD5"

# Close case
CloseCase

# Run script: Script → Execute → Select .xss file
Common X-Script Tasks
# Carve files by type
CarveByType "PDF,DOC,XLS" "C:\Carved"

# Search for keywords
SearchKeywords "C:\Keywords.txt"
ExportResults "C:\KeywordHits.csv"

# Generate timeline
CreateTimeline "C:\Timeline.csv" "2024-01-01..2024-01-31"

# Export registry values
ExportRegistryKey "SYSTEM\CurrentControlSet\Enum\USBSTOR" "C:\USB.csv"

# Tag suspicious files
TagFiles "*.exe" "Suspicious Executable"
TagFiles "*password*" "Contains password"
⚠️ Troubleshooting Common Issues
| Issue | Possible Cause | Solution |
|---|---|---|
| Cannot open image file | Unsupported format or corrupted image | Convert to RAW using FTK Imager; verify image hash |
| Slow performance with large images | Insufficient RAM or HDD instead of SSD | Increase RAM (16GB+); move case to SSD; use 64-bit version |
| Carving produces no results | Files overwritten or wrong file types selected | Adjust carving signature strength; select more file types |
| Registry hive won't load | Corrupted hive or transaction logs missing | Use Registry Viewer's transaction log parsing; repair with wevtutil |
| Timeline missing events | Wrong time range or file system not supported | Expand time range; ensure NTFS/ExFAT file system |
| Cannot find deleted files | File system overwritten or TRIM enabled (SSD) | Use file carving on unallocated space; check for artifacts |
📋 Forensic Best Practices with X-Ways Forensics
- Always use write-blocker - Prevent accidental modification when accessing live drives
- Verify image hashes - Calculate MD5/SHA256 before and after analysis
- Document case notes - Record all analysis steps for chain of custody
- Use multiple views - Directory browser + hex viewer + detail panel together
- Leverage keyboard shortcuts - Significantly speeds up analysis
- Filter before searching - Reduce scope to improve performance
- Export evidence early - Extract suspicious files immediately for backup
- Validate carving results - Carved files may be incomplete; verify with hex viewer
- Keep X-Ways updated - Regular updates add new features and file signatures
- Use X-Script for repetitive tasks - Automate common analysis workflows
- Cross-validate findings - Use another forensic tool to confirm critical evidence
- Maintain case backups - Regular backups of case files to external drive
📋 Quick Reference Card
- Create new case (File → New)
- Add evidence (File → Add Evidence)
- Navigate file system (Directory Browser)
- Search for keywords (Ctrl+F)
- Calculate hashes (Tools → Compute Hash)
- Carve deleted files (Specialist → File Carving)
- Analyze registry (double-click hive files)
- Create timeline (Timeline → Create Timeline)
- Tag evidence (Right-click → Tag)
- Generate report (Report → Create Report)
Ctrl+N - New case
Ctrl+A - Add evidence
Ctrl+F - Search
F3 - Hex view
Ctrl+H - Toggle hex viewer
Ctrl+Shift+T - Timeline
F5 - Refresh
Space - Quick view
X-Ways Forensics should only be used on evidence you have legal authority to examine. The tool's powerful carving and recovery capabilities can recover sensitive data; always maintain proper chain of custody and document all analysis steps for court admissibility.
Tool 4: Registry Analyzer (Zimmerman Tools)
Registry Analyzer (Zimmerman Tools) extracts forensic artifacts from Windows Registry, including user activity, USB history, program execution, and system configuration. It is a free, portable suite of tools for deep registry forensics.
- Free and lightweight (no licensing costs)
- Extracts hidden and deleted registry artifacts
- Supports offline registry hives from forensic images
- Timeline analysis with Timeline Explorer integration
- CSV/JSON/XML export for further analysis
- Command-line automation with RECmd
- YARA rule scanning for malware detection
- Registry differential analysis (compare before/after)
📥 Complete Installation Guide
Step 1: Download Zimmerman Tools Suite
# Official download URLs (all free)
https://ericzimmerman.github.io/
https://github.com/EricZimmerman/RegistryExplorer/releases

# Download the following tools (all free):
- RegistryExplorer (main registry analysis GUI)
- Timeline Explorer (view CSV timelines visually)
- RECmd (command-line registry analysis for automation)
- JLECmd (Jumplist analysis)
- LECmd (LNK file analysis)
- EvtxeCmd (Event log analysis)
- SQLECmd (SQLite database analysis)
Step 2: Extract and Organize Tools
# Recommended folder structure:
C:\ZimmermanTools\
├── RegistryExplorer\
│   └── RegistryExplorer.exe
├── RECmd\
│   ├── RECmd.exe
│   └── BatchFiles\
│       ├── Batch.reb
│       ├── Timeline.reb
│       ├── USB.reb
│       └── UserActivity.reb
├── TimelineExplorer\
│   └── TimelineExplorer.exe
├── JLECmd\
│   └── JLECmd.exe
├── LECmd\
│   └── LECmd.exe
└── EvtxeCmd\
    └── EvtxeCmd.exe

# Extract all tools to the same parent folder for easy access
Step 3: Launch Registry Explorer
# No installation required - portable application
Double-click RegistryExplorer.exe

# First run setup:
- Accept license agreement
- Check for updates (Tools → Check for Updates)
- Configure default timezone (Tools → Options → Timezone)

# Verification:
- GUI should load without errors
- File menu shows standard options
- Version displayed in title bar📚 Understanding Windows Registry for Forensics
What is the Windows Registry?
The Windows Registry is a hierarchical database that stores configuration settings, user preferences, system information, and application data. It is a goldmine of forensic evidence because it records user activity, program execution, hardware connections, and system changes.
Main Registry Hives and Their Locations
| Hive File | Location in Windows | Forensic Value | Key Artifacts |
|---|---|---|---|
| SYSTEM | C:\Windows\System32\config\SYSTEM |
System configuration, USB history, services, network settings, shutdown times\n | USBSTOR, services, ControlSet, TimeZone, NetworkList\n |
| SOFTWARE | C:\Windows\System32\config\SOFTWARE |
Installed programs, Windows settings, file associations, OS version\n | InstalledApps, Windows Update history, file extensions\n |
| SAM | C:\Windows\System32\config\SAM |
User account information, password hashes, last login times\n | Local user accounts, password hashes (with SYSTEM)\n |
| SECURITY | C:\Windows\System32\config\SECURITY |
Security policies, audit settings, cached logon credentials\n | LSA secrets, audit policy, cached domain credentials\n |
| DEFAULT | C:\Windows\System32\config\DEFAULT |
Default user profile settings (applied to new users)\n | Default user configuration\n |
| NTUSER.DAT | C:\Users\[Username]\NTUSER.DAT |
User-specific settings, activity, MRU lists, program execution\n | UserAssist, RecentDocs, TypedURLs, Run MRU, ShellBags\n |
| USRCLASS.DAT | C:\Users\[Username]\AppData\Local\Microsoft\Windows\USRCLASS.DAT |
Shell artifacts, recent files, search history, Start menu\n | RecentDocs (alternate), ShellBags, StartMenu\n |
How to Extract Registry Hives from Evidence
# Method 1: Using FTK Imager (free, recommended for forensic images)
1. Open FTK Imager
2. File → Add Evidence Item → Image File
3. Navigate to C:\Windows\System32\config\
4. Right-click each hive → Export Files → Save to case folder
5. For each user: Navigate to C:\Users\[Username]\
6. Export NTUSER.DAT and USRCLASS.DAT

# Method 2: From live system (Admin PowerShell) - Use write-blocker!
reg save HKLM\SYSTEM C:\Case\SYSTEM.hiv
reg save HKLM\SOFTWARE C:\Case\SOFTWARE.hiv
reg save HKLM\SAM C:\Case\SAM.hiv
reg save HKLM\SECURITY C:\Case\SECURITY.hiv
reg save HKU\.DEFAULT C:\Case\DEFAULT.hiv

# For each user profile (get SID first)
wmic useraccount get name,sid
reg save "HKU\[SID]" C:\Case\NTUSER_[Username].hiv

# Method 3: Using KAPE (Kroll Artifact Parser and Extractor)
kape.exe --target WindowsRegistry --source E:\ --dest C:\Case\Registry
📂 Step-by-Step: Loading and Analyzing Registry Hives
Step 1: Open Registry Explorer
- Launch
RegistryExplorer.exefrom extracted folder - Click "File" → "Load Hive" or press Ctrl+L
- Browse to the registry hive file (e.g., SYSTEM, NTUSER.DAT)
- Click "Open" to load
- Hive appears in left panel with root key
Step 2: Navigate Registry Structure
- Use left panel to browse registry keys (similar to regedit)
- Expand folders to navigate to specific keys
- Click any key to view values in right panel
- Double-click any value to see detailed information (data type, size, raw data)
- Use search (Ctrl+F) to find specific keys, values, or data
- Use Find Next (F3) to continue search
Step 3: Analyze Timestamps (Last Write Time)
Registry Explorer shows Last Write Time for each key - this is critical forensic evidence indicating when a key was last modified.
- 🟢 Green timestamp - Recent activity (last 30 days) - High relevance
- 🟡 Yellow timestamp - Moderate age (30-90 days) - Medium relevance
- ⚪ Gray timestamp - Old activity (90+ days) - Lower relevance
- 🔴 Red timestamp - Future date (system clock issue or tampering)
🔍 Key Forensic Artifacts to Extract
1️⃣ USB Device History (Data Exfiltration Evidence)
# Registry path for USB storage devices
HKLM\SYSTEM\CurrentControlSet\Enum\USBSTOR

# What you'll find:
- Device serial number (unique identifier for tracking)
- First install date (Last Write Time of key)
- Last connected date (Last Write Time of parent key)
- Device description and manufacturer
- Device size (for storage devices)

# Export USB history:
Navigate to USBSTOR → Right-click → Export Key → Save as CSV

# Forensic significance:
- Track specific USB device across multiple systems
- Identify data exfiltration timeframe
- Link physical USB device to computer
2️⃣ Program Execution History (UserAssist) - Malware Detection
# Registry path for UserAssist (per user)
NTUSER.DAT\Software\Microsoft\Windows\CurrentVersion\Explorer\UserAssist

# What you'll find:
- Programs executed by user (even from USB drives)
- Execution count (Registry Explorer auto-decrypts ROT-13)
- Last execution time (Last Write Time)
- Full file path of executed programs

# Forensic significance:
- Identify malware execution
- Track program usage patterns
- Find portable apps run from USB
- Detect anti-forensics (cleared UserAssist shows as deleted)

# Note: UserAssist data is ROT-13 encoded; Registry Explorer auto-decodes
3️⃣ Recent Documents (File Access Evidence)
# Registry paths for recent documents
NTUSER.DAT\Software\Microsoft\Windows\CurrentVersion\Explorer\RecentDocs
NTUSER.DAT\Software\Microsoft\Windows\CurrentVersion\Explorer\RecentDocs\.docx
NTUSER.DAT\Software\Microsoft\Windows\CurrentVersion\Explorer\RecentDocs\.pdf

# What you'll find:
- Recently opened files (grouped by extension)
- Maximum 150 entries (Windows default)
- File names (not full paths - use ShellBags for paths)
- MRU order (most recent first)

# Forensic significance:
- Identify accessed sensitive documents
- Establish file access timeline
- Correlate with USB activity
4️⃣ Auto-start Programs (Malware Persistence)
# Registry paths for auto-start programs
HKLM\SOFTWARE\Microsoft\Windows\CurrentVersion\Run
HKLM\SOFTWARE\Microsoft\Windows\CurrentVersion\RunOnce
HKCU\SOFTWARE\Microsoft\Windows\CurrentVersion\Run
HKCU\SOFTWARE\Microsoft\Windows\CurrentVersion\RunOnce
HKLM\SOFTWARE\Microsoft\Windows\CurrentVersion\RunServices
HKLM\SOFTWARE\Microsoft\Windows NT\CurrentVersion\Winlogon

# What you'll find:
- Malware persistence mechanisms
- Legitimate startup programs
- Command line arguments
- File paths of auto-starting executables

# Forensic significance:
- Detect malware that persists across reboots
- Identify suspicious startup entries
- Establish attacker persistence timeline
5️⃣ Network History (Mapped Drives & Network Activity)
# Registry path for mapped drives
NTUSER.DAT\Software\Microsoft\Windows\CurrentVersion\Explorer\Map Network Drive MRU

# Registry path for network shares accessed
NTUSER.DAT\Software\Microsoft\Windows\CurrentVersion\Explorer\NetworkMRU

# What you'll find:
- Network share paths accessed (UNC paths)
- Drive letters mapped
- Last connection time (Last Write Time)
- Persistent vs temporary mappings

# Forensic significance:
- Identify lateral movement
- Track data access on network shares
- Detect unauthorized network access
6️⃣ Windows Installation and System Information
# Registry path for system info
HKLM\SOFTWARE\Microsoft\Windows NT\CurrentVersion

# What you'll find:
- Windows version and build number
- Installation date (InstallDate - Unix timestamp)
- Registered owner and organization
- Product ID and license key (partial)
- Edition (Home, Pro, Enterprise)

# Forensic significance:
- Establish system age
- Verify OS version for profile selection
- Correlate with other system artifacts
7️⃣ Browser Artifacts (Typed URLs - Internet Explorer/Edge)
# Registry path for typed URLs
NTUSER.DAT\Software\Microsoft\Internet Explorer\TypedURLs
NTUSER.DAT\Software\Microsoft\Internet Explorer\TypedURLsTime
# What you'll find:
- URLs typed directly into address bar
- Up to 50 entries (url1, url2, etc.)
- Sequential access order
- Timestamps in separate key
# Forensic significance:
- Identify user's web activity
- Detect access to malicious/phishing sites
- Correlate with browser history files8️⃣ Wireless Network History (Location Tracking)
# Registry path for wireless networks (Windows 10/11)
HKLM\SOFTWARE\Microsoft\Windows NT\CurrentVersion\NetworkList\Signatures\Unmanaged
HKLM\SOFTWARE\Microsoft\Windows NT\CurrentVersion\NetworkList\Profiles
# What you'll find:
- SSID of connected wireless networks
- First connection time (DateLastConnected)
- Last connection time
- Network adapter used
- Security type (WPA2, WEP, Open)
# Forensic significance:
- Track physical location of device
- Identify networks accessed
- Establish presence at specific locations9️⃣ User Account Information (SAM - Local Account Details)
# Registry path for user accounts (requires SYSTEM hive also)
HKLM\SAM\SAM\Domains\Account\Users\Names
HKLM\SAM\SAM\Domains\Account\Users\[RID]
# What you'll find:
- List of local user accounts
- Last login time (in user key - Last Write Time)
- Password hash location (needs SYSTEM to decrypt)
- Account disabled/enabled status
- Account type (Admin, User, Guest)
# To view password hashes:
- Need both SAM and SYSTEM hives
- Tools → Analyze → Password Hashes
- Or use: Registry Explorer → SAM → Right-click → Dump Password Hashes
# Forensic significance:
- Identify all local accounts
- Detect unauthorized accounts
- Extract password hashes for cracking🔟 ShellBags (Folder Access - Even After Deletion!)
# Registry paths for ShellBags
NTUSER.DAT\Software\Microsoft\Windows\Shell\BagMRU
NTUSER.DAT\Software\Microsoft\Windows\Shell\Bags
USRCLASS.DAT\Local Settings\Software\Microsoft\Windows\Shell\BagMRU
# What you'll find:
- Folders accessed (even if files were deleted)
- Folder navigation history (including external drives)
- Last access time for folders
- Evidence of accessed external/USB drives
- Folder view preferences
# Forensic significance:
- PROVES user accessed specific folders
- Remains even after files are deleted
- Critical for external drive forensics
- Shows folder structure exploration1️⃣1️⃣ Recent Apps (Windows 10/11 Start Menu)
# Registry path for recent apps
NTUSER.DAT\Software\Microsoft\Windows\CurrentVersion\Search\RecentApps
# What you'll find:
- Recently launched applications
- Execution timestamps
- Application IDs
# Forensic significance:
- Supplemental program execution evidence
- Works even if UserAssist is cleared1️⃣2️⃣ Taskbar and Start Menu MRU
# Registry paths
NTUSER.DAT\Software\Microsoft\Windows\CurrentVersion\Explorer\Taskband
NTUSER.DAT\Software\Microsoft\Windows\CurrentVersion\Explorer\StartPage2
# What you'll find:
- Pinned items on taskbar
- Recent items in Start menu
- Program launch shortcuts
# Forensic significance:
- Additional program execution evidence
- User preferences and habits⌨️ RECmd - Command Line Registry Analysis (Automation)
Installing and Using RECmd
# RECmd is part of Zimmerman Tools suite
# Location: C:\ZimmermanTools\RECmd\RECmd.exe
# Basic usage - single file
RECmd.exe -f "C:\Case\SYSTEM" --csv "C:\Case\Output"
# Batch process all hives in directory
RECmd.exe -d "C:\Case\RegistryHives" --csv "C:\Case\Output"
# Use pre-built batch files (in BatchFiles folder)
RECmd.exe -f "C:\Case\NTUSER.DAT" --bn "C:\ZimmermanTools\RECmd\BatchFiles\Batch.reb"
# Available RECmd batch files:
- Batch.reb (comprehensive analysis - everything)
- Timeline.reb (timeline-focused events only)
- USB.reb (USB device history only)
- UserActivity.reb (user activity focus - UserAssist, RecentDocs)
- AutoStart.reb (persistence mechanisms only)
- Network.reb (network-related artifacts only)RECmd Batch Analysis Example
# Comprehensive analysis of all hives from forensic image
# Step 1: Create folder: C:\Case\RegistryHives
# Step 2: Copy all extracted .hiv files to this folder
# Step 3: Run RECmd on entire folder
RECmd.exe -d "C:\Case\RegistryHives" --bn "Batch.reb" --csv "C:\Case\RECmdOutput"
# Output files generated:
- RegistryExplorer.csv (all parsed data combined)
- Timeline.csv (timeline-ready format for Timeline Explorer)
- NTUSER_UserAssist.csv (UserAssist specific)
- SYSTEM_USB.csv (USB history specific)
- SOFTWARE_InstalledApps.csv (installed programs)
- SAM_UserAccounts.csv (user account information)
- Security_Policies.csv (security settings)
# Step 4: Load CSV files into Timeline Explorer for visualization
TimelineExplorer.exe → File → Open → Select Timeline.csvCreating Custom RECmd Batch Files
# Custom batch file format (.reb)
# Example: Custom.reb
# Format: Plugin,OutputColumnName,RegistryPath,Key,Value
Plugin:UserAssist,UserAssist Path,NTUSER.DAT\Software\Microsoft\Windows\CurrentVersion\Explorer\UserAssist
Plugin:USBSTOR,USB Device,SYSTEM\CurrentControlSet\Enum\USBSTOR
Plugin:Run,Startup Programs,SOFTWARE\Microsoft\Windows\CurrentVersion\Run
# Run with custom batch file
RECmd.exe -d "C:\Case\RegistryHives" --bn "C:\Custom.reb" --csv "C:\Case\CustomOutput"📅 Creating Timelines with Registry Data
Using Timeline Explorer (Visual Timeline)
# Step 1: Launch Timeline Explorer
TimelineExplorer.exe
# Step 2: Open CSV output from RECmd
File → Open → Select Timeline.csv
# Step 3: Configure timeline view
- Set timestamp column to "Timestamp" or "LastWriteTime"
- Group by event type or user
- Color-code by artifact type (UserAssist, USB, etc.)
# Features available:
- Sort by timestamp column
- Filter by event type (checkboxes)
- Filter by date range (slider)
- Search for specific keywords (Ctrl+F)
- Group by user or registry path
- Export filtered results (File → Export)
- Create timeline charts (View → Chart)Manual Timeline Creation
# Export individual registry keys with timestamps
# In Registry Explorer:
Navigate to key → Right-click → Export Key → CSV format
# Combine multiple exports into single timeline
# Use Timeline Explorer to merge CSV files
Tools → Merge Timelines → Select all CSV files → OK
# Alternative: Use PowerShell to combine
Get-ChildItem *.csv | ForEach-Object { Import-Csv $_ } | Export-Csv merged_timeline.csv -NoTypeInformation🎯 Practical Registry Forensics Examples
Example 1: Identify USB Device Used for Data Theft
# Step 1: Load SYSTEM hive
Registry Explorer → File → Load Hive → SYSTEM
# Step 2: Navigate to USBSTOR
SYSTEM\CurrentControlSet\Enum\USBSTOR
# Step 3: Review each USB device
For each device subkey, check:
- Last Write Time (last connection timestamp)
- Serial number (unique identifier for tracking)
- Device description (e.g., "SanDisk Ultra USB Device")
- FriendlyName (user-friendly name)
# Step 4: Look for suspicious devices
- Large capacity drives (64GB, 128GB, 1TB)
- Recently connected (last 7 days)
- Unusual or generic descriptions
- Multiple connections (indicates repeated use)
# Step 5: Cross-reference with other artifacts
- Check SetupAPI logs for exact connection times
- Check ShellBags for folders accessed on USB drive
- Check Prefetch for executables run from USB
- Check RecentDocs for files opened from USB
# Step 6: Document findings for court
- Serial number (matches physical device if seized)
- First and last connection dates
- Connection countExample 2: Find When Malware Was Executed
# Step 1: Load user's NTUSER.DAT hive
Registry Explorer → File → Load Hive → NTUSER.DAT
# Step 2: Navigate to UserAssist
NTUSER.DAT\Software\Microsoft\Windows\CurrentVersion\Explorer\UserAssist
# Step 3: Review program execution history
For each entry, note:
- Program name (Registry Explorer auto-decodes ROT-13)
- Execution count (how many times run)
- Last execution time (Last Write Time)
# Step 4: Look for suspicious executables
- Powershell.exe with encoded commands
- Cmd.exe running from unusual locations
- Executables from Temp or AppData folders
- Unknown or randomly named files
# Step 5: Check Run keys for persistence
HKLM\SOFTWARE\Microsoft\Windows\CurrentVersion\Run
HKCU\SOFTWARE\Microsoft\Windows\CurrentVersion\Run
# Step 6: Check Scheduled Tasks via Registry
HKLM\SOFTWARE\Microsoft\Windows NT\CurrentVersion\Schedule\TaskCache\Tasks
# Step 7: Correlate with other evidence
- Event logs (4688 - Process Creation)
- Prefetch files (.pf in C:\Windows\Prefetch)
- Amcache.hve for program executionExample 3: Determine System Installation Date
# Step 1: Load SOFTWARE hive
Registry Explorer → File → Load Hive → SOFTWARE
# Step 2: Navigate to Windows NT CurrentVersion
SOFTWARE\Microsoft\Windows NT\CurrentVersion
# Step 3: Check InstallDate value
Value: InstallDate
Type: REG_DWORD
Data: Unix timestamp (seconds since 1970-01-01)
# Convert timestamp:
- Method 1: Timeline Explorer automatically converts
- Method 2: Online converter (epochconverter.com)
- Method 3: PowerShell: [DateTime]::FromFileTimeUtc($timestamp * 10000000)
# Alternative: Check FirstInstallDate in same key
Value: FirstInstallDate (human-readable format)
# Forensic significance:
- Determine system age
- Verify if system was installed before incident
- Correlate with other timeline eventsExample 4: Recover Deleted UserAssist Data
# Important: Registry keys are never truly deleted - marked for deletion
# Registry Explorer can view these "deleted" keys
# Step 1: Enable showing deleted keys
View → Show Deleted Keys (check the box)
# Step 2: Navigate to UserAssist
NTUSER.DAT\Software\Microsoft\Windows\CurrentVersion\Explorer\UserAssist
# Step 3: Look for entries with [Deleted] prefix
# These are keys that were cleared but still recoverable
# Step 4: Review deleted UserAssist entries
# May contain execution history that user attempted to clear
# Step 5: Export deleted keys for evidence
Right-click [Deleted] key → Export Key → CSV
# Forensic significance:
- Anti-forensics detection (user tried to clear history)
- Recovery of "cleaned" execution evidence
- Proves intent to hide activityExample 5: Detect Malware Persistence via Registry
# Step 1: Load SOFTWARE and SYSTEM hives
Registry Explorer → File → Load Hive → SOFTWARE
Registry Explorer → File → Load Hive → SYSTEM
# Step 2: Check all Run keys
# System-wide
HKLM\SOFTWARE\Microsoft\Windows\CurrentVersion\Run
HKLM\SOFTWARE\Microsoft\Windows\CurrentVersion\RunOnce
HKLM\SOFTWARE\WOW6432Node\Microsoft\Windows\CurrentVersion\Run
# User-specific (load each NTUSER.DAT)
HKCU\SOFTWARE\Microsoft\Windows\CurrentVersion\Run
HKCU\SOFTWARE\Microsoft\Windows\CurrentVersion\RunOnce
# Step 3: Check Winlogon (critical)
HKLM\SOFTWARE\Microsoft\Windows NT\CurrentVersion\Winlogon
Values: Shell, Userinit, Notify
# Step 4: Check Services
HKLM\SYSTEM\CurrentControlSet\Services
Look for suspicious service names, ImagePath pointing to unusual locations
# Step 5: Check Scheduled Tasks via Registry
HKLM\SOFTWARE\Microsoft\Windows NT\CurrentVersion\Schedule\TaskCache\Tasks
# Step 6: Check BootExecute
HKLM\SYSTEM\CurrentControlSet\Control\Session Manager
Value: BootExecute
# Step 7: Document suspicious entries
- Unknown executable names
- Paths in Temp or AppData
- Recently added entries (check Last Write Time)
- Discrepancies between Run and RunOnceExample 6: Track Lateral Movement via Network Artifacts
# Step 1: Load NTUSER.DAT of suspect user
Registry Explorer → File → Load Hive → NTUSER.DAT
# Step 2: Check mapped network drives
NTUSER.DAT\Software\Microsoft\Windows\CurrentVersion\Explorer\Map Network Drive MRU
# Step 3: Check network shares accessed
NTUSER.DAT\Software\Microsoft\Windows\CurrentVersion\Explorer\NetworkMRU
# Step 4: Check Remote Desktop connections (RDP)
NTUSER.DAT\Software\Microsoft\Terminal Server Client\Default
Also check: NTUSER.DAT\Software\Microsoft\Terminal Server Client\Servers
# Step 5: Check RecentDocs for network file access
NTUSER.DAT\Software\Microsoft\Windows\CurrentVersion\Explorer\RecentDocs
# Step 6: Check for PSExec usage (lateral movement tool)
HKLM\SOFTWARE\Microsoft\Windows\CurrentVersion\Policies\System
Look for PSEXESVC service or related artifacts
# Step 7: Build lateral movement timeline
- First mapped drive to target server
- File access on network share
- RDP connections to other systems
- Process execution on remote systems📄 Generating Forensic Reports
Exporting Registry Evidence
# Export specific keys as CSV (for Excel analysis)
Right-click key → Export Key → CSV → Save
# Export entire hive with timestamps
File → Export → All Keys with Timestamps → CSV
# Export as JSON (for programmatic analysis)
File → Export → All Keys → JSON
# Generate HTML report (for court submission)
File → Generate Report → HTML → Select sections → Generate
# Generate PDF (using browser print after HTML generation)
Open HTML report in browser → Print → Save as PDFWhat to Include in Registry Report
- Case information - Case number, examiner name, date of analysis
- Registry hives examined - List of files with hash values and source locations
- USB device history - All connected devices with serial numbers and timestamps
- Program execution history - UserAssist data with execution counts and times
- Auto-start programs - Persistence mechanisms found in Run keys
- Recent documents - Recently accessed files with names
- Typed URLs - Web addresses typed into browser address bar
- Wireless network connections - SSIDs and connection times
- User account information - Local accounts and status
- System information - OS version, install date, registered owner
- ShellBags - Folder access history (including external drives)
- Timeline visualization - Chronological chart of registry events
- Anomalies found - Deleted keys, unusual entries, tampering indicators
⚠️ Troubleshooting Common Issues
| Issue | Possible Cause | Solution |
|---|---|---|
| "Cannot load hive" error | Corrupted hive file or incorrect file format | Use hive recovery tool; verify file hash; extract again from image |
| UserAssist shows encoded/encrypted data | Data not automatically decoded | Registry Explorer auto-decodes ROT-13; check View → Decode Values setting |
| No USB devices in USBSTOR | No USB devices ever connected, or hive from fresh install | Check SetupAPI logs for USB events; verify correct SYSTEM hive loaded |
| Timestamps not displaying correctly | Time zone mismatch between system and evidence | Set correct time zone in Tools → Options → Timezone; timestamps are UTC |
| Cannot view SAM password hashes | Need both SAM and SYSTEM hives for decryption | Load both SAM and SYSTEM hives, then Tools → Analyze → Password Hashes |
| Registry Explorer very slow | Very large hive file (multiple GB) or low system resources | Use RECmd command line instead; filter results; increase RAM |
| Deleted keys not showing | "Show Deleted Keys" option not enabled | View → Show Deleted Keys (check the box) |
| Export fails for large key | Key has too many subkeys or values | Export individual subkeys; use RECmd for large exports |
🚀 Advanced Features
Registry Differential Analysis (Before/After Comparison)
# Compare two registry hives (e.g., before and after incident)
# Step 1: Load first hive (baseline - before incident)
File → Load Hive → Baseline hive
# Step 2: Load second hive (compare - after incident)
File → Load Hive → Compare hive
# Step 3: View differences in the Diff Viewer:
- Keys added (green highlighting)
- Keys removed (red highlighting)
- Keys modified (yellow highlighting)
- Value changes (detailed in bottom panel)
# Step 4: Export differences for report
Right-click in Diff Viewer → Export Differences → CSV
# Forensic significance:
- Identify what changed during incident
- Detect malware persistence added
- Find user account creations
- Track configuration changesRegistry Key Bookmarking
# Bookmark frequently analyzed keys for quick access
Navigate to key → Right-click → Add to Bookmarks
# Organize bookmarks into folders
Bookmarks window → Right-click → New Folder → Name folder
# Drag and drop keys between folders
# View all bookmarks
View → Bookmarks
# Export bookmarked keys for report
Bookmarks window → Export All → CSV
# Load saved bookmarks in future cases
File → Load Bookmarks → Select .json fileYARA Rule Scanning for Malware Detection
# Scan registry for malware indicators using YARA rules
Tools → YARA Scan
# Load YARA rules
Click "Load Rules" → Select .yar file (e.g., malware_rules.yar)
# Select registry keys to scan:
- All keys (entire hive)
- Current key only
- Selected keys
# Run scan and review matches
Results show:
- Matching rule name
- Registry key path
- Value name and data
# Export results
Right-click results → Export → CSV
# Forensic significance:
- Automatically detect known malware indicators in registry
- Find persistence mechanisms
- Identify ransomware markers
- Detect C2 configuration dataExtracting Registry Values as Files
# Extract binary registry values as files
Navigate to key with binary value (REG_BINARY)
Right-click value → Save Binary Data As → Select filename
# Common use cases:
- Extract SAM password hashes for offline cracking
- Extract SSL/TLS certificates
- Extract stored credentials
- Extract malware configuration data📋 Forensic Best Practices for Registry Analysis
- Always work on copies - Never analyze original registry hives from live evidence
- Document Last Write Times - These are critical forensic evidence for timelines
- Verify timestamps - Convert Unix timestamps correctly; note UTC vs local time
- Cross-reference artifacts - USBSTOR + SetupAPI + ShellBags = complete USB timeline
- Use multiple tools - Validate findings with RegRipper, Registry Explorer, and manual regedit
- Export raw data - Keep original CSV exports for court evidence and reproducibility
- Understand time zones - Registry uses UTC; convert to local time for your jurisdiction
- Update tools regularly - New artifacts and Windows versions are discovered frequently
- Enable deleted key view - Always check for deleted keys; they may contain cleared history
- Document hashes - Calculate MD5/SHA256 of extracted hives and export files
- Maintain chain of custody - Document every hive extraction and analysis step
- Use RECmd for automation - Batch process multiple hives for consistent results
Quick Reference: Most Important Registry Keys
# ========== SYSTEM HIVE ==========
HKLM\SYSTEM\CurrentControlSet\Enum\USBSTOR - USB devices (storage)
HKLM\SYSTEM\CurrentControlSet\Enum\USB - All USB devices
HKLM\SYSTEM\CurrentControlSet\Control\TimeZoneInformation - Timezone
HKLM\SYSTEM\Select - Last Known Good
HKLM\SYSTEM\CurrentControlSet\Services - Installed services
HKLM\SYSTEM\CurrentControlSet\Control\ComputerName - Computer name
# ========== SOFTWARE HIVE ==========
HKLM\SOFTWARE\Microsoft\Windows NT\CurrentVersion - OS version, install date
HKLM\SOFTWARE\Microsoft\Windows\CurrentVersion\Run - Auto-start programs
HKLM\SOFTWARE\Microsoft\Windows\CurrentVersion\Uninstall - Installed programs
HKLM\SOFTWARE\Microsoft\Windows\CurrentVersion\App Paths - Application paths
# ========== SAM HIVE (requires SYSTEM) ==========
HKLM\SAM\SAM\Domains\Account\Users\Names - User accounts
HKLM\SAM\SAM\Domains\Account\Users\[RID] - User details, last login
# ========== NTUSER.DAT (per user) ==========
NTUSER.DAT\Software\Microsoft\Windows\CurrentVersion\Explorer\UserAssist - Program execution
NTUSER.DAT\Software\Microsoft\Windows\CurrentVersion\Explorer\RecentDocs - Recent files
NTUSER.DAT\Software\Microsoft\Internet Explorer\TypedURLs - Typed URLs
NTUSER.DAT\Software\Microsoft\Windows\Shell\BagMRU - Accessed folders
NTUSER.DAT\Software\Microsoft\Windows\CurrentVersion\Run - User auto-start
NTUSER.DAT\Software\Microsoft\Windows\CurrentVersion\Explorer\Map Network Drive MRU - Mapped drives
NTUSER.DAT\Software\Microsoft\Terminal Server Client\Default - RDP connectionsRegistry analysis should only be performed on evidence you have legal authority to examine. The Windows Registry contains highly sensitive user information including passwords, browsing history, personal data, and system configurations. Handle all evidence with appropriate confidentiality, maintain proper chain of custody, and document all analysis steps for court admissibility.
Tool 5: Event Log Analyzer (EvtxeCmd) – Windows Event Log
EvtxeCmd is a powerful Windows Event Log analysis tool from Eric Zimmerman's suite that parses EVTX files to extract security events, login attempts, process creation, and system changes. It is fast, memory-efficient, and ideal for batch processing large log files.
- Fast EVTX parsing (millions of events in minutes)
- Export to CSV, JSON, XML, SQLite, and Elasticsearch
- Filter by event ID, time range, source, or custom criteria
- Batch processing for entire log directories
- Memory-efficient for files over 100MB+
- Preserves original event timestamps and data
📥 Complete Installation Guide
Step 1: Download EvtxeCmd
# Official GitHub repository
https://github.com/EricZimmerman/evtx
# Direct download (latest release)
https://github.com/EricZimmerman/evtx/releases
# Download the following files:
- EvtxeCmd.exe (main executable)
- EvtxeCmd.exe.config (configuration file)
- Full suite recommended (all Zimmerman Tools)Step 2: Extract and Organize
# Recommended folder structure (Zimmerman Tools suite)
C:\ZimmermanTools\
├── EvtxeCmd\
│ ├── EvtxeCmd.exe
│ └── EvtxeCmd.exe.config
├── TimelineExplorer\
│ └── TimelineExplorer.exe
├── RECmd\
│ └── RECmd.exe
└── RegistryExplorer\
└── RegistryExplorer.exe
# Extract all tools to the same parent folder for easy accessStep 3: Verify Installation
# Open Command Prompt as Administrator
cd C:\ZimmermanTools\EvtxeCmd
# Display help (verify working)
EvtxeCmd.exe -h
# Expected output shows version and command options📚 Understanding Windows Event Logs for Forensics
Windows Event Log Locations
| Log Name | File Location | Forensic Value |
|---|---|---|
| Security (Security.evtx) | C:\Windows\System32\winevt\Logs\Security.evtx |
Logon attempts, account changes, privilege use, object access\n |
| System (System.evtx) | C:\Windows\System32\winevt\Logs\System.evtx |
Driver installations, service starts/stops, system shutdowns/boots\n |
| Application (Application.evtx) | C:\Windows\System32\winevt\Logs\Application.evtx |
Application errors, crashes, and events\n |
| PowerShell (Windows PowerShell.evtx) | C:\Windows\System32\winevt\Logs\Windows PowerShell.evtx |
PowerShell command history, script execution\n |
| Setup (Setup.evtx) | C:\Windows\System32\winevt\Logs\Setup.evtx |
Software installation, Windows updates\n |
| Forwarded Events (ForwardedEvents.evtx) | C:\Windows\System32\winevt\Logs\ForwardedEvents.evtx |
Events collected from other systems (centralized logging)\n |
How to Extract Event Logs from Evidence
# Method 1: From live system (Admin PowerShell)
wevtutil epl Security C:\Case\Security.evtx
wevtutil epl System C:\Case\System.evtx
wevtutil epl Application C:\Case\Application.evtx
# Method 2: From forensic image using FTK Imager
1. Open FTK Imager
2. Add evidence item (image or physical drive)
3. Navigate to C:\Windows\System32\winevt\Logs\
4. Right-click each .evtx file → Export Files
5. Save to case folder
# Method 3: Using raw file copy (from mounted image)
copy "E:\Windows\System32\winevt\Logs\*.evtx" C:\Case\EventLogs\📊 Critical Event IDs - Complete Reference
🟢 Authentication & Logon Events (Security Log)
| Event ID | Description | Forensic Significance | Attack Indicator |
|---|---|---|---|
| 4624 | Successful logon | User authentication evidence, session start | Normal activity; track user behavior |
| 4625 | Failed logon | Brute-force attempts, password guessing | Multiple failures → brute force attack |
| 4634 | Logon session terminated | Session duration calculation | Correlate with 4624 for session length |
| 4648 | Logon with explicit credentials | Service account usage, RunAs activity | Potential privilege escalation |
| 4672 | Special privileges assigned to new logon | Admin logon detection | Administrative access evidence |
🔵 Process Creation & Execution Events
| Event ID | Description | Forensic Significance | Attack Indicator |
|---|---|---|---|
| 4688 | Process creation (with command line) | Malware execution, suspicious process detection | Unknown/unexpected processes, PowerShell execution |
| 4689 | Process termination | Process lifetime tracking | Correlate with 4688 for execution duration |
| 4698 | Scheduled task created | Persistence mechanism detection | Malware scheduled task creation |
| 7045 | Service installed | Persistence, malware installation | Unknown service creation |
🟡 Account Management Events
| Event ID | Description | Forensic Significance | Attack Indicator |
|---|---|---|---|
| 4720 | User account created | Persistence, backdoor account detection | Unknown account creation |
| 4722 | User account enabled | Access restoration | Disabled account re-enabled |
| 4726 | User account deleted | Cover-up attempts | Evidence destruction |
| 4732 | User added to security-enabled group | Privilege escalation | Added to Domain Admins, Administrators |
🔴 Evidence Tampering Events (RED FLAG)
| Event ID | Description | Forensic Significance | Action Required |
|---|---|---|---|
| 1102 | Audit log cleared | RED FLAG - Evidence tampering! | Immediately investigate surrounding events |
| 104 | System log cleared | Log file was cleared | Check for other tampering indicators |
| 4719 | System audit policy changed | Audit bypass attempt | Review policy changes and who made them |
🚨 Detecting Event Log Tampering
Indicators of Log Manipulation
- Event ID 1102 - Audit log cleared (major red flag)
- Gaps in event sequences - Missing expected event IDs
- Timeline inconsistencies - Events out of chronological order
- Event ID 104 - Log file was cleared (System log)
- Corrupted or missing log files - Attacker deleted logs
- Event ID 4719 - System audit policy was changed
Checking for Log Clearing
# Find audit log clear events
EvtxeCmd.exe -f Security.evtx --csv output -fd "EventID=1102"
# Find system log clear events
EvtxeCmd.exe -f System.evtx --csv output -fd "EventID=104"
# Check for gaps (using Timeline Explorer)
TimelineExplorer.exe # Load CSV and look for time gaps⌨️ EvtxeCmd Advanced Commands & Options
Basic Syntax
EvtxeCmd.exe -f <evtx_file> [options]
EvtxeCmd.exe -d <directory> [options]Output Formats
# CSV output (most common, Excel-friendly)
EvtxeCmd.exe -f Security.evtx --csv C:\output
# JSON output (structured data, programmatic analysis)
EvtxeCmd.exe -f Security.evtx --json C:\output
# XML output (original format preservation)
EvtxeCmd.exe -f Security.evtx --xml C:\output
# SQLite database (for complex queries)
EvtxeCmd.exe -f Security.evtx --sqlite C:\output\events.dbFiltering Options
# Filter by single Event ID
EvtxeCmd.exe -f Security.evtx --csv output -fd "EventID=4624"
# Filter by multiple Event IDs
EvtxeCmd.exe -f Security.evtx --csv output -fd "EventID=4624,4625,4648"
# Filter by date range (UTC)
EvtxeCmd.exe -f Security.evtx --csv output -fd "TimeCreated>2024-01-15"
EvtxeCmd.exe -f Security.evtx --csv output -fd "TimeCreated>=2024-01-01 AND TimeCreated<=2024-01-31"
# Filter by source (for forwarded events)
EvtxeCmd.exe -f ForwardedEvents.evtx --csv output -fd "Computer=DESKTOP-ABC123"Batch Processing
# Process all EVTX files in directory
EvtxeCmd.exe -d "C:\Case\EventLogs" --csv C:\output
# Process recursively (include subdirectories)
EvtxeCmd.exe -d "C:\Case\EventLogs" --csv C:\output --recurse
# Process with filter (only Security logs)
EvtxeCmd.exe -d "C:\Case\EventLogs" --csv C:\output -fn "Security*.evtx"Additional Options
# Include original XML in output
EvtxeCmd.exe -f Security.evtx --csv output --xml
# Include event data (message strings)
EvtxeCmd.exe -f Security.evtx --csv output --inc
# Override timezone (default UTC)
EvtxeCmd.exe -f Security.evtx --csv output --tz "Eastern Standard Time"🎯 Practical Event Log Analysis Examples
Example 1: Detecting Brute Force Attacks
# Step 1: Extract all failed logon attempts
EvtxeCmd.exe -f Security.evtx --csv output -fd "EventID=4625"
# Step 2: Count failures per source IP (from CSV)
# Open output.csv in Excel/Timeline Explorer
# Create pivot table: Source IP → Count
# Step 3: Look for success after multiple failures
EvtxeCmd.exe -f Security.evtx --csv output -fd "EventID=4624,4625"
# Step 4: Check for account lockouts
EvtxeCmd.exe -f Security.evtx --csv output -fd "EventID=4740"Example 2: Malware Execution Investigation
# Step 1: Find all process creations
EvtxeCmd.exe -f Security.evtx --csv output -fd "EventID=4688"
# Step 2: Find service installations (persistence)
EvtxeCmd.exe -f System.evtx --csv output -fd "EventID=7045"
# Step 3: Find scheduled tasks created
EvtxeCmd.exe -f Security.evtx --csv output -fd "EventID=4698"
# Step 4: Check for PowerShell script execution
EvtxeCmd.exe -f "Windows PowerShell.evtx" --csv outputExample 3: Insider Threat Investigation
# Step 1: Find user's successful logons
EvtxeCmd.exe -f Security.evtx --csv output -fd "EventID=4624 AND TargetUserName=jsmith"
# Step 2: Find network share access
EvtxeCmd.exe -f Security.evtx --csv output -fd "EventID=5140"
# Step 3: Check for privileged group membership changes
EvtxeCmd.exe -f Security.evtx --csv output -fd "EventID=4732,4733"
# Step 4: Check for after-hours access
EvtxeCmd.exe -f Security.evtx --csv output -fd "TimeCreated>=2024-01-15T18:00:00"📅 Visualizing Event Logs with Timeline Explorer
Creating Event Timeline
# Step 1: Export events to CSV
EvtxeCmd.exe -f Security.evtx --csv timeline_output
# Step 2: Launch Timeline Explorer
TimelineExplorer.exe
# Step 3: Load CSV
File → Open → Select timeline_output.csv
# Step 4: Configure timeline view
- Set timestamp column to "TimeCreated"
- Group by event type (EventID)
- Color-code by severity
# Step 5: Filter by time range and identify attack patterns📄 Generating Forensic Reports from Event Logs
Creating Comprehensive Reports
# Step 1: Export all relevant events
EvtxeCmd.exe -d "C:\Case\EventLogs" --csv C:\Case\Reports\All_Events
# Step 2: Extract specific findings
EvtxeCmd.exe -f Security.evtx --csv C:\Case\Reports\Failed_Logons -fd "EventID=4625"
EvtxeCmd.exe -f Security.evtx --csv C:\Case\Reports\Process_Creations -fd "EventID=4688"
EvtxeCmd.exe -f Security.evtx --csv C:\Case\Reports\Log_Changes -fd "EventID=1102,4719,4902"
# Step 3: Include in final forensic report
- Event log summary table
- Timeline visualization
- Critical event findings
- Log tampering indicators⚠️ Troubleshooting Common Issues
| Issue | Possible Cause | Solution |
|---|---|---|
| "Access denied" error | Insufficient permissions, file in use | Run as Administrator; copy log file first |
| Empty output | Filter too restrictive or corrupted file | Remove filters; verify file with wevtutil |
| Timestamps incorrect | Time zone mismatch | Use --tz flag to specify correct timezone |
| Very slow processing | Huge EVTX file (100MB+) | Use filtering to reduce data; upgrade hardware |
📋 Forensic Best Practices for Event Log Analysis
- Always work on copies - Never analyze original EVTX files directly
- Verify log integrity - Check file hashes before and after analysis
- Preserve original timestamps - Event logs are critical timeline evidence
- Document time zones - Event logs are UTC; note conversion in reports
- Cross-reference logs - Correlate Security, System, and Application logs
- Check for tampering - Always look for Event ID 1102 and gaps
- Use multiple tools - Validate EvtxeCmd findings with Event Viewer
- Maintain chain of custody - Document every log file access and export
Quick Reference: Most Important Event IDs for Incident Response
# Authentication (Immediate check)
4624 - Successful logon
4625 - Failed logon
4648 - Logon with explicit credentials
4672 - Admin logon
# Process Execution
4688 - Process creation (with command line)
7045 - Service installed
4698 - Scheduled task created
# Account Changes
4720 - User created
4732 - User added to group
4726 - User deleted
# Evidence Tampering
1102 - Audit log cleared (RED ALERT!)
104 - System log cleared
4719 - Audit policy changedEvent log analysis should only be performed on evidence you have legal authority to examine. Windows Event Logs may contain sensitive information including usernames, IP addresses, and system details. Always maintain proper chain of custody and document all analysis steps.
Tool 6: USB Detective – Advanced USB Forensics
USB Detective is a specialized forensic tool for analyzing USB device history, tracking USB storage usage, and identifying data exfiltration. It provides deep analysis of Windows Registry, SetupAPI logs, and other artifacts to create a complete USB timeline.
- Comprehensive USB device history analysis across multiple artifacts
- Cross-references Registry, SetupAPI, Event Logs, and ShellBags
- Creates complete USB connection timeline with confidence scoring
- Identifies first and last connection times with millisecond precision
- Extracts serial numbers, device IDs, and vendor information
- Generates detailed forensic reports with visual timelines
- Supports offline analysis of forensic images
- Detects USB device spoofing and hiding techniques
📥 Free Download (Community Edition)
Official Website (Community Edition - Free)
https://usbdetective.com/community-download/Professional Edition (Commercial)
https://usbdetective.com/professional/📥 Installation & Setup
Standard Installation
# Step 1: Download USB Detective installer from official website
# Step 2: Run installer as Administrator
# Step 3: Accept license agreement
# Step 4: Choose installation directory (default: C:\Program Files\USBDetective)
# Step 5: Select components (Core + Optional Log parsers)
# Step 6: Complete installation
# Step 7: Launch USB Detective from Start MenuPortable Version (Recommended for Forensics)
# Step 1: Download USB Detective Portable.zip
# Step 2: Extract to USB drive or forensic workstation
# Step 3: Run USBDetective.exe (no installation required)
# Step 4: The application runs completely from USB drive📚 Key Artifacts Analyzed by USB Detective
| Artifact Source | Information Extracted | Forensic Value |
|---|---|---|
| Windows Registry (USBSTOR) | Device make/model, serial number, first install date, last connection date, device size | Primary source of USB device history; unique serial numbers for tracking |
| SetupAPI Logs | Exact connection/disconnection timestamps, driver installation events, device instance IDs | More precise timestamps than Registry; confirms device installation |
| Windows Event Logs | System events related to USB device plug/unplug (Event IDs 2003, 2100, 2102, 2106)\] | Additional timestamp verification; detects device removal\] |
| ShellBags (Registry)\] | Folders accessed on USB drives, evidence of file browsing, last access times\] | Proves user viewed specific files/folders on USB device\] |
| Prefetch Files\] | Executables run from USB drives, execution timestamps, run count\] | Evidence of portable application execution from USB\] |
| LNK Files\] | Recently accessed files on USB drives, target paths, volume serial numbers\] | Links specific files to USB device; file access evidence\] |
| Amcache.hve\] | Program execution history including USB-executed applications\] | Additional execution evidence for portable apps\] |
📊 Step-by-Step USB Forensic Analysis
Step 1: Launch USB Detective and Create Case
- Launch USB Detective (as Administrator for live systems)
- Click "New Case" or "Load Evidence"
- Enter case name and number for documentation
- Select evidence source type
Step 2: Select Evidence Source
- Live System - Running Windows computer (requires write-blocker)
- Forensic Image - E01, DD, RAW, or VMDK image files
- Extracted Registry Files - Individual hive files from evidence
- Mounted Volume - Already mounted forensic image
Step 3: Select Registry Hives and Logs
# Required files (minimum):
- SYSTEM hive (from C:\Windows\System32\config\)
- SOFTWARE hive (from C:\Windows\System32\config\)
# Optional but recommended:
- NTUSER.DAT (for each user profile - ShellBags, RecentDocs)
- SetupAPI.log or SetupAPI.dev.log (C:\Windows\INF\)
- Windows Event Logs (System.evtx)
# Using FTK Imager to extract:
1. Open FTK Imager
2. Add evidence item (forensic image)
3. Navigate to C:\Windows\System32\config\
4. Right-click SYSTEM, SOFTWARE → Export Files
5. Navigate to C:\Users\[Username]\
6. Export NTUSER.DAT for each userStep 4: Analyze USB History
- Click "Analyze" to process selected evidence
- Wait for analysis to complete (depends on evidence size)
- Review USB Device Summary table:
- Device Make/Model - Manufacturer and product name
- Serial Number - Unique identifier for tracking
- First Connection - When device first plugged in
- Last Connection - Most recent connection
- Connection Count - How many times connected
- Confidence Score - Reliability of detected data
- Expand each device to see detailed timeline
- Switch to "Timeline View" for chronological visualization
- Switch to "File Access View" to see files accessed on USB
Step 5: Export Findings
# Export options available:
- Export to CSV (for Excel analysis)
- Export to HTML (for reports)
- Export to PDF (for court submission)
- Export to JSON (for integration)
# How to export:
File → Export → Select format → Choose destination → Save🎯 Practical Forensic Use Cases
Use Case 1: Data Exfiltration Investigation
# Scenario: Sensitive data was leaked; need to identify USB drives used
# Step 1: Load evidence in USB Detective
Load SYSTEM hive and user NTUSER.DAT files
# Step 2: Analyze USB history
Review USB Device Summary for:
- Large capacity USB drives (32GB, 64GB, 128GB, 1TB)
- Devices with recent first connections (during incident window)
- Drives with high connection counts (frequent use)
# Step 3: Identify suspicious devices
Look for:
- Generic device names (may indicate spoofing)
- Unusual brands not typical for organization
- Devices connected outside business hours
# Step 4: Cross-reference with file access
Check "File Access View" for:
- Sensitive file names (confidential, HR, financial, client data)
- File types (.docx, .xlsx, .pdf, .zip)
- File access timestamps matching incident window
# Step 5: Build timeline
Export timeline to CSV and integrate with:
- User login/logout times
- Building access logs
- Network activity logs
# Step 6: Document findings
Include in forensic report:
- USB device make/model and serial number
- First and last connection dates
- Files accessed on USB device
- Timeline of activityUse Case 2: Detecting USB Device Spoofing
# Scenario: Attacker using spoofed USB device to evade detection
# Step 1: Run USB Detective on suspect system
# Step 2: Look for anomalies in USB Device Summary:
- Device with no serial number (VID/PID only)
- Device with generic description ("USB Mass Storage Device")
- Device claiming to be one type but behaving as another
- Multiple devices with same serial number (cloned/spoofed)
# Step 3: Cross-reference SetupAPI logs
Check for:
- Driver installation failures
- Device setup class mismatches
- Multiple device instances with same identifiers
# Step 4: Check Event Logs for anomalies
Look for Event ID 2003, 2100, 2102 patterns:
- Rapid connect/disconnect cycles
- Devices connecting without proper driver installation
# Step 5: Document spoofing indicators for expert testimonyUse Case 3: Forensic Timeline of USB Activity
# Scenario: Need to create complete timeline of all USB connections
# Step 1: Load all available evidence in USB Detective
- SYSTEM hive (primary USB data)
- SetupAPI logs (precise timestamps)
- Windows Event Logs (verification)
- Multiple NTUSER.DAT files (user-specific)
# Step 2: Generate comprehensive timeline
Click "Timeline View" → Set date range → Generate
# Step 3: Review timeline entries showing:
- First connection time (Registry)
- Subsequent connections (SetupAPI)
- File access times (ShellBags)
- Executable runs (Prefetch)
# Step 4: Export timeline to CSV
File → Export → CSV → Select all fields
# Step 5: Import into Timeline Explorer
Combine with other forensic artifacts:
- Event logs (logon/logoff)
- Network activity
- File system changes
# Step 6: Correlate with incident window
Identify USB activity during critical timeframeUse Case 4: Offline Forensic Image Analysis
# Scenario: Analyzing forensic image without booting the system
# Step 1: Mount forensic image read-only
Using FTK Imager or Arsenal Image Mounter
# Step 2: Extract required files from mounted image
C:\Windows\System32\config\SYSTEM
C:\Windows\System32\config\SOFTWARE
C:\Windows\INF\setupapi.dev.log
C:\Windows\System32\winevt\Logs\System.evtx
C:\Users\[Username]\NTUSER.DAT (for each user)
# Step 3: Load extracted files into USB Detective
File → Load Evidence → Extracted Files → Select all
# Step 4: Analyze as if live system
USB Detective processes offline files same as live
# Step 5: Export findings without ever booting suspect system
# This maintains evidence integrity (no registry modifications)Use Case 5: Cross-Device Correlation (Same USB on Multiple Systems)
# Scenario: Same USB device used on multiple computers in organization
# Step 1: Run USB Detective on each suspect computer
# Or analyze forensic images from each computer
# Step 2: Export USB Device Summary from each system
USB Detective → Export → CSV → usb_device_summary.csv
# Step 3: Extract serial numbers from each report
# Serial number is the unique identifier for tracking
# Step 4: Compare serial numbers across computers
# Find matching serial numbers indicating same device used
# Step 5: Build cross-system timeline
# When was device first seen on each computer?
# What files were accessed from each computer?
# Step 6: Map device movement across organization
# Correlate with physical access logs, security footage
# Identify user who had access to all computersUse Case 6: Detecting Portable Application Execution
# Scenario: Attacker ran hacking tools from USB drive
# Step 1: Run USB Detective with Prefetch analysis enabled
# Step 2: Review "Executables Run from USB" section
# Step 3: Look for suspicious executable names:
- nmap.exe, metasploit.exe, mimikatz.exe
- powershell.exe, cmd.exe (if run from USB)
- unknown or randomly named executables
# Step 4: Check execution timestamps
# Correlate with incident window
# Step 5: Cross-reference with Amcache.hve
# Verify execution evidence from multiple sources
# Step 6: Document portable application evidence
# Include in forensic report as malware execution proof🔍 Interpreting USB Detective Results
Confidence Score System
| Confidence Score | Meaning | Artifacts Found |
|---|---|---|
| High (90-100%) | Device data confirmed by multiple sources | Registry + SetupAPI + Event Logs all agree |
| Medium (60-89%) | Data from Registry only, limited confirmation | Registry matches SetupAPI but no Event Logs |
| Low (below 60%) | Partial data, possible incomplete artifacts | Registry only, or conflicting sources |
Red Flags to Look For
- Recent First Connection During Incident - Device introduced around attack time
- No Serial Number - May indicate spoofed or malicious device
- Large Capacity Drive - Potential data theft (64GB, 128GB, 1TB)
- Multiple Connections in Short Time - Automated enumeration
- After-Hours Connections - Unauthorized access
- Generic Device Descriptions - May hide true device identity
- Executables Run from USB - Potential portable hacking tools
- Sensitive Files Accessed on USB - Evidence of data theft
⚠️ Troubleshooting Common Issues
| Issue | Possible Cause | Solution |
|---|---|---|
| "No USB devices found"\] | Registry hive corrupted or wrong path\] | Verify SYSTEM hive integrity; re-extract from image\] |
| "Low confidence scores on all devices"\] | SetupAPI logs missing or cleared\] | Add SetupAPI.log and Event Logs for verification\] |
| "Cannot load forensic image"\] | Unsupported format or corrupted image\] | Mount image with FTK Imager first; then load extracted files\] |
| "Missing ShellBags data"\] | NTUSER.DAT not loaded or user never accessed USB\] | Load NTUSER.DAT for each user profile; check other users\] |
| "Timeline shows gaps"\] | Log files cleared or overwritten\] | Use available data; note gaps in report; check Event Logs\] |
📋 Forensic Best Practices with USB Detective
- Always use portable version - Leaves no traces on examined system
- Run on forensic images - Not on live evidence when possible
- Load all available artifacts - Registry + SetupAPI + Event Logs + NTUSER.DAT for complete picture
- Document confidence scores - Important for court testimony about reliability
- Export to multiple formats - CSV for analysis, PDF for court, HTML for review
- Cross-reference with other tools - Validate findings with USBDeview or Registry Explorer
- Calculate file hashes - Document MD5/SHA256 of exported reports
- Include in forensic report - Add USB timeline as appendix
- Note missing artifacts - Document if SetupAPI logs were cleared (indicates tampering)
- Correlate with physical evidence - Match serial numbers to seized USB drives
📋 Quick Reference Card
- Mount forensic image (read-only)
- Extract SYSTEM, SOFTWARE, NTUSER.DAT, SetupAPI.log
- Launch USB Detective (portable version)
- Load extracted files as evidence
- Run analysis
- Review USB Device Summary for anomalies
- Check File Access View for sensitive files
- Generate timeline and export to CSV
- Export findings to PDF for court
- Include USB analysis in forensic report
- Serial numbers (for device tracking)
- First and last connection dates
- Files accessed on USB drives
- Executables run from USB
- Confidence scores for each finding
USB forensic analysis should only be performed on evidence you have legal authority to examine. USB Detective can reveal detailed user activity including file access, application execution, and potential data theft. Always maintain proper chain of custody and document all analysis steps.
Tool 7: USBDeview – USB Device Viewer
USBDeview is a lightweight, free utility from NirSoft that lists all USB devices that have been connected to a Windows computer, along with detailed information and connection history.
- Free and portable (no installation required)
- Displays all connected USB devices (storage, mice, keyboards, webcams, printers)
- Shows first connection and last connection times with full timestamps
- Extracts unique serial numbers for device tracking
- Can uninstall or disable USB devices (administrative functions)
- Export to CSV, HTML, XML, JSON, or text
- Supports remote registry analysis and offline forensic images
- Command-line support for automation and batch processing
📥 Free Download
Official Download (NirSoft)
https://www.nirsoft.net/utils/usb_devices_view.htmlAlternative Download Sources (Free)
# MajorGeeks
https://www.majorgeeks.com/files/details/usbdeview.html
# Softpedia
https://www.softpedia.com/get/System/System-Info/USBDeview.shtml
# PortableApps.com
https://portableapps.com/apps/utilities/usbdeview-portable📥 Installation & Setup
Portable Version (Recommended for Forensics)
# Step 1: Download usbdeview.zip from NirSoft
# Step 2: Extract to USB drive or case folder
# Step 3: Run USBDeview.exe (no installation required)
# Step 4: The application runs completely from the USB drive
# Files included in download:
- USBDeview.exe (main application)
- USBDeview.chm (help file)
- readme.txt (documentation)Installer Version (Optional)
# Step 1: Download usbdeview_setup.exe
# Step 2: Run installer with Administrator privileges
# Step 3: Follow installation wizard
# Step 4: Launch from Start Menu📚 Understanding USB Forensic Artifacts
What USBDeview Extracts from Windows
- Registry Key:
HKLM\SYSTEM\CurrentControlSet\Enum\USBSTOR- USB storage devices - Registry Key:
HKLM\SYSTEM\CurrentControlSet\Enum\USB- All USB devices - SetupAPI Logs:
C:\Windows\INF\setupapi.dev.log- Device installation events - Windows Event Logs: System.evtx - USB plug/unplug events (Event ID 2003, 2100, 2102)
Key Information Extracted per USB Device
| Field | Description | Forensic Value |
|---|---|---|
| Device Description | Make and model of the USB device (e.g., "SanDisk Ultra USB 3.0") | Identify the type and brand of device used |
| Device Type | Mass Storage, HID (keyboard/mouse), Printers, Webcams, Network adapters | Determine if device was for data transfer (Mass Storage) or other purposes |
| Serial Number | Unique identifier for each USB device (e.g., "0301823049182391") | Track specific device across multiple computers; link to physical evidence |
| First Install Date | Timestamp when device was first connected to the system | Establish when a device was introduced to the system |
| Last Plug/Unplug Date | Most recent connection and disconnection times | Identify recent activity, possible data exfiltration timeframe |
| VendorID / ProductID | Hardware identifiers (e.g., VID_0781 PID_5583) | Look up device manufacturer online; identify device without description |
| Friendly Name | User-assigned or system-assigned device name | May contain user context or drive letter assignments |
| Drive Letter (Mass Storage) | Letter assigned to USB drive (e.g., "E:", "F:") | Identify where device was mounted in file system |
🔍 Using USBDeview for Forensics
Option 1: Live System Analysis (Triage)
- Run USBDeview.exe as Administrator (for complete data)
- Review all USB devices in the main window
- Key columns to examine for forensics:
- Device Description - Make/model of device
- Device Type - Mass Storage indicates potential data transfer
- Serial Number - Unique identifier for tracking
- First Install Date - When device first connected
- Last Plug/Unplug Date - Recent activity timeline
- VendorID/ProductID - Hardware identifiers
- Drive Letter - Where USB was mounted (Mass Storage only)
- Sort by Last Plug Date to see most recent connections
- Export findings: View → HTML Report - All Items
Option 2: Offline Registry Analysis (Forensic Images)
# Step 1: Extract registry hives from forensic image
# Using FTK Imager: Navigate to C:\Windows\System32\config\
# Export SYSTEM and SOFTWARE hives to case folder
# Step 2: Run USBDeview on extracted registry
USBDeview.exe /registry "C:\Case\Registry\SYSTEM" /scomma offline_report.csv
# Step 3: For user-specific USB history (ShellBags, RecentDocs)
# Extract NTUSER.DAT from each user profile
USBDeview.exe /registry "C:\Case\Registry\NTUSER_JohnDoe.DAT" /scomma user_report.csv
# Step 4: Analyze multiple registry files together
USBDeview.exe /registry "C:\Case\Registry\SYSTEM" /registry "C:\Case\Registry\SOFTWARE" /shtml full_report.htmlOption 3: Remote Computer Analysis
# Analyze remote computer (requires admin permissions and remote registry service)
USBDeview.exe /remote "\\TARGET_COMPUTER" /shtml remote_report.html
# For multiple computers (batch script)
for /f %i in (computers.txt) do (
USBDeview.exe /remote "\\%i" /scomma "C:\Cases\%i_usb.csv"
)⌨️ Command Line Options for Automation
Export Formats
# CSV format (best for Excel analysis)
USBDeview.exe /scomma "C:\Case\USB_Report.csv"
# HTML format (best for reports)
USBDeview.exe /shtml "C:\Case\USB_Report.html"
# XML format (best for programmatic analysis)
USBDeview.exe /sxml "C:\Case\USB_Report.xml"
# Tab-delimited text
USBDeview.exe /stab "C:\Case\USB_Report.txt"
# JSON format (web applications)
USBDeview.exe /sjson "C:\Case\USB_Report.json"Filtering Options
# Show only Mass Storage devices (USB drives)
USBDeview.exe /scomma storage_report.csv /filter "Device Type=Mass Storage"
# Show only devices connected in last 30 days
USBDeview.exe /shtml recent_report.html /filter "Last Plug Date>2024-03-01"
# Show only currently connected devices
USBDeview.exe /scomma connected_report.csv /show_connected
# Filter by specific vendor
USBDeview.exe /shtml sandisk_report.html /filter "Device Description=SanDisk"
# Exclude system devices (mouse, keyboard) for cleaner report
USBDeview.exe /scomma storage_only.csv /filter "Device Type=Mass Storage"Advanced Options
# Sort by last plug date (most recent first)
USBDeview.exe /shtml sorted_report.html /sort "Last Plug Date"
# Include only devices with serial numbers
USBDeview.exe /scomma with_serial.csv /filter "Serial Number!="
# Run silently (no UI) for batch processing
USBDeview.exe /scomma report.csv /sort "Last Plug Date" /NoLogo
# Display full path of registry keys (for advanced analysis)
USBDeview.exe /shtml detailed_report.html /DisplayRegistryKey🎯 Practical Forensic Use Cases
Use Case 1: Data Exfiltration Investigation
# Scenario: Sensitive data was leaked; need to identify USB drives used
# Step 1: Run USBDeview on suspect system
USBDeview.exe /scomma usb_analysis.csv
# Step 2: Filter for Mass Storage devices only
# Look for large capacity drives (16GB, 32GB, 64GB, 1TB)
# Step 3: Focus on devices connected during incident timeframe
# Check "First Install Date" and "Last Plug Date"
# Step 4: Extract unique serial numbers for each device
# Serial numbers can be used to identify physical device if recovered
# Step 5: Cross-reference with:
- ShellBags (folders accessed on USB)
- RecentDocs (files opened from USB)
- LNK files (shortcuts to USB files)
- Prefetch files (executables run from USB)
# Step 6: Document findings in forensic reportUse Case 2: Tracking Multiple USB Devices Across Systems
# Scenario: Same USB device used on multiple computers in organization
# Step 1: Run USBDeview on all suspect computers
USBDeview.exe /scomma computer1_usb.csv
USBDeview.exe /scomma computer2_usb.csv
USBDeview.exe /scomma computer3_usb.csv
# Step 2: Extract serial numbers from each report
# Serial number is the best identifier for tracking
# Step 3: Compare serial numbers across computers
# Find matching serial numbers indicating same device used
# Step 4: Build timeline of device usage across systems
# When was it first seen on each computer?
# Step 5: Use findings to map device movement
# Correlate with physical access logs, security footageUse Case 3: Identifying Malicious USB Devices (Rubber Ducky, BadUSB)
# Scenario: Possible HID attack using malicious USB device
# Step 1: Run USBDeview on suspect system
USBDeview.exe /shtml usb_report.html
# Step 2: Look for suspicious Device Type "HID" (Human Interface Device)
# HID devices can simulate keyboard/mouse for attacks
# Step 3: Check for devices with:
- Unusual or generic descriptions ("HID Keyboard", "USB Input Device")
- Recent first install dates (around incident time)
- No recognizable manufacturer
# Step 4: Look for multiple HID devices connecting rapidly
# Rubber Ducky often appears as keyboard
# Step 5: Cross-reference with Event Logs (Event ID 2003, 2100, 2102)
# Step 6: Check for PowerShell/cmd.exe executions around same timeUse Case 4: Forensic Timeline of USB Activity
# Scenario: Need to create timeline of all USB connections
# Step 1: Export USB data with full details
USBDeview.exe /scomma usb_full_timeline.csv
# Step 2: Sort by "First Install Date" and "Last Plug Date"
# Step 3: Import CSV into Timeline Explorer or Excel
# Step 4: Create timeline visualization showing:
- When each device first connected
- When each device last connected
- Duration between first and last connection
# Step 5: Correlate with:
- File access times from ShellBags
- Network activity times
- User login/logout times
# Step 6: Identify data exfiltration windowsUse Case 5: Offline Forensic Image Analysis
# Scenario: Analyzing forensic image without booting the system
# Step 1: Mount forensic image using FTK Imager (read-only)
# Step 2: Navigate to C:\Windows\System32\config\
# Step 3: Export SYSTEM and SOFTWARE hives to case folder
# Step 4: Run USBDeview on exported hives
USBDeview.exe /registry "C:\Case\SYSTEM" /scomma system_usb.csv
# Step 5: For user-specific USB artifacts, export NTUSER.DAT from:
# C:\Users\[Username]\NTUSER.DAT
# Step 6: Run USBDeview on each NTUSER.DAT
USBDeview.exe /registry "C:\Case\NTUSER_Admin.DAT" /scomma admin_usb.csv
# Step 7: Combine reports for complete USB history🔍 Interpreting USBDeview Results
What Different Device Types Indicate
| Device Type | Forensic Significance | Suspicious Indicators |
|---|---|---|
| Mass Storage | Potential data transfer (copy to/from system) | Large capacity, recent connection during incident, unusual brand |
| HID (Keyboard/Mouse) | Normal user input OR potential BadUSB/Rubber Ducky attack | Multiple HID devices, generic descriptions, connection at unusual times |
| Printers | Document printing activity | Printing sensitive documents around incident time |
| Network Adapter | USB-to-Ethernet or Wi-Fi adapter usage | Alternative network access, bypassing security |
| Webcam | Video/photo capture capability | Surveillance, unauthorized recording |
Red Flags to Look For
- Recent First Install Date - Device introduced around incident time
- Multiple Large Capacity Drives - Potential data theft
- Generic Device Descriptions - May indicate spoofed or malicious devices
- No Serial Number - Some malicious devices may hide serial numbers
- Rapid Succession of Connections - Automated enumeration or attack
- Device Connected After Hours - Unauthorized access
⚠️ Troubleshooting Common Issues
| Issue | Possible Cause | Solution |
|---|---|---|
| "No USB devices shown" | Insufficient permissions or wrong registry path | Run as Administrator; verify registry hive path |
| "Registry file not found" | Incorrect path or corrupted hive | Verify path; use FTK Imager to extract fresh copy |
| Missing timestamps for some devices | Registry data incomplete or cleared | Check SetupAPI logs for additional timestamp data |
| Cannot connect to remote computer | Remote Registry service not running or firewall block | Start Remote Registry service; check firewall rules | Export file is empty | Filter too restrictive or no matching devices | Remove filters; run without filters first |
📋 Forensic Best Practices with USBDeview
- Always use portable version - Leaves no traces on examined system
- Run as Administrator - Ensures complete registry access
- Run on forensic images - Not on live evidence when possible
- Export to multiple formats - CSV for analysis, HTML for reports, JSON for integration
- Document serial numbers - Critical for device tracking across systems
- Cross-reference with other artifacts - SetupAPI logs, Event Logs, ShellBags, Prefetch
- Calculate file hashes - Document MD5/SHA256 of export files
- Include in forensic report - Add USB history as appendix
- Verify timestamps - Ensure correct timezone interpretation
- Correlate with physical evidence - Match serial numbers to seized USB drives
📋 Quick Reference Card
- Download portable version to forensic workstation
- Extract SYSTEM and SOFTWARE hives from forensic image
- Run USBDeview on extracted hives
- Export results to CSV and HTML
- Filter for Mass Storage devices only
- Document serial numbers, first/last connection dates
- Cross-reference with other USB artifacts
- Include findings in forensic report
# Quick analysis
USBDeview.exe /scomma report.csv
# Offline registry
USBDeview.exe /registry "SYSTEM" /shtml report.html
# Mass storage only
USBDeview.exe /scomma storage.csv /filter "Device Type=Mass Storage"USB device analysis should only be performed on evidence you have legal authority to examine. USBDeview is a powerful tool that can reveal detailed user activity including potential data theft. Always maintain proper chain of custody and document all analysis steps.
Tool 8: Belarc Advisor – System Configuration Analyzer
Belarc Advisor builds a detailed profile of a computer's hardware, software, network configuration, security status, and missing Microsoft updates. It is valuable for system baselining and forensic documentation.
- Creates comprehensive system profile
- Lists all installed software with versions
- Shows missing security patches
- Displays hardware inventory (RAM, CPU, drives)
- Shows network adapters and IP addresses
- Generates HTML report for evidence
- Free for personal and forensic use
📥 Free Download
Official Website
https://www.belarc.com/products/belarc-advisorAlternative Download Sources (Free)
# MajorGeeks
https://www.majorgeeks.com/files/details/belarc_advisor.html
# Softpedia
https://www.softpedia.com/get/System/System-Info/Belarc-Advisor.shtml
# FileHippo
https://filehippo.com/download_belarc-advisor/📥 Installation & Setup
Step-by-Step Installation
- Download BelarcAdvisor.exe from official website
- Run installer as Administrator (requires elevated privileges)
- Click "Next" through installation wizard
- Accept the license agreement
- Choose installation directory (default:
C:\Program Files (x86)\Belarc) - Click "Install" to begin installation
- Click "Finish" to complete
- Launch Belarc Advisor from Start Menu or Desktop shortcut
Portable Version (Alternative)
# Belarc Advisor does not officially have a portable version
# However, you can:
1. Install on a clean system
2. Copy the installed folder to USB drive
3. Run from USB on target systems (may require admin rights)
# Note: Some features may not work in portable mode🔍 Running Belarc Advisor for Forensics
Standard Execution (Live System)
- Launch Belarc Advisor from Start Menu
- Click "Next" to start the system scan
- Wait for scan to complete (typically 1-3 minutes)
- Report automatically opens in default web browser
- Review the comprehensive system profile
- Save the HTML report to case folder
Command Line Options (Limited)
# Belarc Advisor has limited command line options
# Run silently (no UI during scan)
BelarcAdvisor.exe /silent
# Specify output directory
BelarcAdvisor.exe /output=C:\Case\BelarcReports
# Run without auto-opening browser
BelarcAdvisor.exe /nobrowser
# Run from network location
\\server\share\BelarcAdvisor.exe /silent /output=C:\Case\Running on Forensic Images
# Method 1: Mount forensic image and run Belarc
1. Mount forensic image using FTK Imager or Arsenal Image Mounter
2. Run Belarc Advisor on the mounted drive letter
3. Scan the mounted system (not the host)
# Method 2: Run on live system before imaging (triage)
1. Run Belarc Advisor on suspect system
2. Save HTML report to external drive
3. Include report with forensic evidence
# Method 3: Virtual machine analysis
1. Convert forensic image to VM format (VMDK, VHD)
2. Boot VM in isolated environment
3. Run Belarc Advisor inside VM📊 What Belarc Advisor Reports
| Report Section | Information Extracted | Forensic Value |
|---|---|---|
| Security Status | Missing Windows updates, antivirus status, firewall status, last update check | Identify vulnerable systems, patch compliance, security posture |
| Software Licenses | Installed applications, versions, license keys, publishers, install dates | Identify unauthorized software, malware, forensic tool presence |
| Hardware Configuration | CPU, RAM, motherboard, drives, serial numbers, BIOS version, manufacturer | Asset documentation, hardware inventory, stolen equipment tracking |
| Network Configuration | IP addresses, MAC addresses, DNS servers, DHCP status, hostname, domain | Network mapping, lateral movement analysis, rogue device detection |
| User Accounts | Local user accounts, groups, permissions, last login (limited) | Account compromise detection, privilege escalation evidence |
| Virtual Machines | Detected VM software, VM configurations, hypervisor type | Identify virtualization, potential evasion techniques |
| Missing Security Patches | List of missing Microsoft security updates (KB numbers) | Vulnerability assessment, exploit correlation |
| Drive Encryption | BitLocker status, encryption type, protector status | Evidence of data protection, potential access issues |
🎯 Forensic Use Cases
Use Case 1: System Baselining Before Investigation
# Scenario: Document clean system state for comparison
# Step 1: Run Belarc Advisor on known clean system
BelarcAdvisor.exe /silent /output=C:\Baseline
# Step 2: Save HTML report as baseline.html
# Step 3: Run Belarc on suspect system after incident
# Step 4: Compare reports for:
- New installed software (malware)
- Changed security settings (disabled AV)
- Missing patches (vulnerabilities)
- New user accounts (persistence)
- Changed network configuration (C2 communication)
# Step 5: Document differences in forensic reportUse Case 2: Malware Infection Documentation
# Scenario: Document system state during malware infection
# Step 1: Run Belarc Advisor on infected system
# Step 2: Review Software Licenses section for:
- Unknown applications installed around infection date
- Pirated software (common malware vector)
- Remote access tools (TeamViewer, AnyDesk)
# Step 3: Review Security Status for:
- Disabled antivirus
- Disabled firewall
- Disabled Windows Update
# Step 4: Review User Accounts for:
- New unauthorized accounts
- Guest account enabled
- Admin account added to users group
# Step 5: Include findings in malware analysis reportUse Case 3: Hardware Asset Documentation for Chain of Custody
# Scenario: Document evidence hardware for court
# Step 1: Run Belarc Advisor on seized system
# Step 2: Record the following from Hardware Configuration:
- Computer manufacturer and model
- Motherboard serial number
- CPU type and speed
- RAM amount and type
- Hard drive model and serial numbers
- Network adapter MAC addresses
# Step 3: Compare with physical labels on evidence
# Step 4: Include Belarc report in evidence documentation
# Step 5: Use for chain of custody verificationUse Case 4: Vulnerability Assessment for Incident Response
# Scenario: Determine how attacker gained access
# Step 1: Run Belarc Advisor on compromised system
# Step 2: Review "Missing Security Patches" section
# Step 3: Identify critical missing patches:
- Remote code execution vulnerabilities (MS17-010, etc.)
- Privilege escalation vulnerabilities
- Browser/Office vulnerabilities
# Step 4: Cross-reference with known exploits
# Step 5: Document timeline of patch installation
# Step 6: Determine if missing patch led to compromiseUse Case 5: Software Inventory for Unauthorized Tools
# Scenario: Identify hacker tools on compromised system
# Step 1: Run Belarc Advisor on suspect system
# Step 2: Review Software Licenses section for:
- Hacking tools (nmap, metasploit, wireshark)
- Password crackers (john, hashcat, ophcrack)
- Remote access tools (VNC, RDP servers, TeamViewer)
- Cryptocurrency miners
- Keyloggers and RATs
# Step 3: Note installation dates
# Step 4: Compare with incident timeline
# Step 5: Document findings for evidence📄 Exporting Reports for Evidence
Report Locations
# Windows 10/11
C:\ProgramData\Belarc\BelarcAdvisor\SystemName\results.html
# Windows 7/8
C:\Documents and Settings\All Users\Application Data\Belarc\BelarcAdvisor\SystemName\
# Linux (via Wine)
/tmp/belarc/
# Network installs
\\server\share\Belarc\results\Export Formats
| Format | How to Export | Best For |
|---|---|---|
| HTML | File → Save As → HTML (or auto-saved to ProgramData) | Quick viewing, internal sharing, hyperlinked navigation |
| Browser → Print → Save as PDF | Court submission, formal documentation, evidence preservation | XML | Belarc Advisor Pro version only | Machine-readable format, integration with other tools | TXT | Copy from browser and paste into text editor | Quick reference, log files, simple documentation |
Best Practices for Evidence Preservation
# Step 1: Run Belarc Advisor on forensic image (not original)
# Step 2: Save HTML report to case folder with case number
# Step 3: Generate PDF version for court submission
# Step 4: Calculate hash of report files (MD5/SHA256)
# Step 5: Include hash in chain of custody documentation
# Step 6: Print PDF to paper for physical evidence (optional)
# Step 7: Include report as appendix in forensic report⚠️ Limitations and Considerations
| Limitation | Impact | Mitigation |
|---|---|---|
| Modifies Registry | Creates registry entries during scan (changes evidence) | Run on forensic image copy, NOT original evidence |
| Requires Administrator | Cannot run without admin privileges | Use in forensics lab with admin access to image |
| No Portable Version | Must be installed on each system | Install on forensic workstation, run on mounted images |
| Windows Only | Does not run on Linux or macOS natively | Use Wine on Linux; macOS requires separate tools |
| Not Designed for Forensics | May leave traces on examined system | Use on forensic images only; document usage |
🔄 Alternative System Information Tools
| Tool | Platform | Forensic Advantage |
|---|---|---|
| WinAudit | Windows | Portable, no installation, open source, digital signatures |
| Sysinternals PsInfo | Windows (command line) | Lightweight, remote execution capable |
| Speccy | Windows | Detailed hardware analysis, portable version available |
| HWiNFO | Windows | Extremely detailed hardware information |
| System Information (msinfo32) | Windows (built-in) | No installation required, native Windows tool |
📋 Forensic Best Practices with Belarc Advisor
- Never run on original evidence - Always use a forensic image copy
- Document usage - Note that Belarc modifies registry during scan
- Use in conjunction with other tools - Cross-validate findings with WinAudit or PsInfo
- Save both HTML and PDF - HTML for review, PDF for court submission
- Calculate file hashes - Document MD5/SHA256 of report files
- Include in forensic report - Add as appendix with explanation
- Run on mounted images - Not on live systems when possible
- Verify report timestamps - Ensure they match examination time
- Document scan date/time - Include in chain of custody
- Use for triage only - Belarc is for system profiling, not deep forensics
📋 Quick Reference Card
- Create forensic image of suspect drive
- Mount image in forensic workstation (write-blocked)
- Install Belarc Advisor on forensic workstation
- Run Belarc Advisor targeting mounted drive
- Save HTML report to case folder
- Print report to PDF for court submission
- Calculate and document file hashes
- Include report in forensic documentation
- Missing Security Patches → Vulnerability assessment
- Software Licenses → Malware identification
- Hardware Configuration → Asset documentation
- User Accounts → Compromise detection
System profiling tools like Belarc Advisor should only be used on evidence you have legal authority to examine. The reports may contain sensitive information including license keys, user names, and network configurations. Maintain proper chain of custody and document all analysis steps.
Tool 9: WinAudit – Comprehensive System Audit
WinAudit is a free, open-source system auditing tool that collects extensive information about a Windows computer, including hardware, software, security settings, and user activity. It can run completely from USB with no installation.
- Free and open-source
- Completely portable (no installation required)
- Over 100 audit categories
- Reports in multiple formats (CSV, XML, HTML, PDF, TXT)
- Cryptographically signed audit results
- Can run from command line for automation
📥 Free Download
Option 1: Official Website (Free)
https://www.winaudit.com/Option 2: Alternative Download Sources (Free)
# GitHub Mirror (official releases)
https://github.com/sandboxie-plus/WinAudit/releases
# MajorGeeks
https://www.majorgeeks.com/files/details/winaudit.html
# Softpedia (clean, verified downloads)
https://www.softpedia.com/get/System/System-Info/WinAudit.shtml
# FossHub
https://www.fosshub.com/WinAudit.html📥 Installation & Setup
# Portable version (recommended for forensics) - Free
Download WinAuditPortable.zip
Extract to USB drive
Run WinAudit.exe
# Installer version (for permanent installations) - Free
Download WinAuditSetup.exe
Run installer with Administrator privileges🔍 Running WinAudit for Forensics
GUI Mode (Interactive)
- Launch WinAudit.exe
- Click "Audit" to start scanning
- Select audit categories (or use defaults)
- Wait for scan to complete (1-3 minutes depending on system)
- Review results in categorized tree view
- Export report: File → Save As → Select format
Command Line Mode (Automated)
# Basic audit with CSV output
WinAudit.exe --out=C:\case\audit.csv --format=csv
# Full audit with HTML report
WinAudit.exe --out=C:\case\audit.html --format=html --full
# Silent mode (no UI) for automation
WinAudit.exe --out=audit.xml --format=xml --silent
# Include digital signature for evidence integrity
WinAudit.exe --out=audit.pdf --format=pdf --sign
# Remote computer audit (requires admin permissions)
WinAudit.exe --remote=COMPUTER_NAME --out=remote_audit.csv📊 Key Audit Categories for Forensics
| Category | Information Extracted | Forensic Value |
|---|---|---|
| Operating System | Version, build, install date, license, service packs, last boot time\n | System baselining, patch history, uptime analysis\n |
| Hardware | CPU, RAM, drives, motherboard, BIOS version, serial numbers, manufacturer\n | Asset documentation, hardware inventory, identifying stolen equipment\n |
| Software Inventory | Installed applications, versions, install dates, publishers, uninstall strings\n | Identify unauthorized software, malware, forensic tools, bloatware\n |
| Network Configuration | IP addresses, MAC addresses, DNS, DHCP, open ports, routing table, adapters\n | Network mapping, lateral movement analysis, rogue device detection\n |
| User Accounts | Local users, groups, last login times, password policies, account status\n | Account compromise detection, privilege escalation evidence\n |
| Security Settings | UAC status, firewall rules, audit policies, encryption status, Windows Defender\n | Security posture assessment, misconfiguration detection\n |
| Event Logs Summary | Event log sizes, oldest/newest events, error counts, log configuration\n | Log integrity checking, tampering detection\n |
| USB History | Connected USB devices (from Registry), first/last connection times\n | Data exfiltration evidence, device tracking\n |
| Auto-start Programs | Programs that run at startup (Registry, scheduled tasks, services, startup folder)\n | Malware persistence detection, suspicious entries\n |
🎯 Practical Forensics Use Cases
Use Case 1: System Baselining Before Investigation
# Step 1: Run WinAudit on clean system before analysis
WinAudit.exe --out=baseline.html --format=html --full
# Step 2: Run WinAudit on suspect system after incident
WinAudit.exe --out=post_incident.html --format=html --full
# Step 3: Compare reports manually or using diff tools
# Look for changes in:
- Installed software (new malicious applications)
- User accounts (unauthorized creations)
- Startup programs (persistence mechanisms)
- Security settings (disabled protections)
- USB history (data exfiltration devices)Use Case 2: Malware Infection Documentation
# Step 1: Run WinAudit on suspected infected system
WinAudit.exe --out=infected_audit.csv --format=csv
# Step 2: Key areas to examine:
# 1. Auto-start Programs - Malware persistence
WinAudit.exe --cat=autostart --out=persistence.csv
# 2. Installed Software - Unknown/untrusted applications
WinAudit.exe --cat=software --out=installed.csv
# 3. Running Processes - Active malware (via tasklist)
WinAudit.exe --cat=processes --out=running.csv
# 4. Services - Malware services
WinAudit.exe --cat=services --out=services.csv
# 5. User Accounts - New unauthorized accounts
WinAudit.exe --cat=users --out=accounts.csvUse Case 3: Evidence Integrity with Digital Signatures
# Step 1: Generate signed audit report
WinAudit.exe --out=court_audit.pdf --format=pdf --sign
# Step 2: The signature cryptographically proves:
# - Report was generated by WinAudit (authenticity)
# - Contents haven't been altered (integrity)
# - Timestamp of generation (non-repudiation)
# Step 3: Include signed PDF in forensic report appendix
# Step 4: Verify signature before presenting in court
WinAudit.exe --verify=court_audit.pdf📄 Export Formats for Different Purposes
| Format | Best For | Command Line | Advantages |
|---|---|---|---|
| CSV | Data analysis in Excel, timeline creation, pivot tables\n | --format=csv |
Easy to filter, sort, and analyze numerically\n |
| HTML | Quick viewing in browser, internal sharing, executive summaries\n | --format=html |
Visually organized, hyperlinked navigation\n |
| Court submission, formal documentation, evidence preservation\n | --format=pdf --sign |
Tamper-proof with digital signature, professional presentation\n | |
| XML | Integration with other tools, scripting, data transformation\n | --format=xml |
Machine-readable, schema validation, API integration\n |
| TXT | Plain text reports, log files, quick reference\n | --format=txt |
Lightweight, readable on any system\n |
⚠️ Troubleshooting Common Issues
| Issue | Possible Cause | Solution |
|---|---|---|
| "Access denied" error | Insufficient permissions for certain registry keys\n | Run as Administrator; use portable version on forensic image\n |
| Website returns status 307 | Temporary redirect or server issue\n | Use alternative download sources (GitHub, MajorGeeks, Softpedia)\n |
| Report missing data | Audit category not selected or system restriction\n | Run with --full flag; check system permissions\n
|
| Remote audit fails | Network access issues or insufficient remote permissions\n | Enable admin shares; use local execution with copied tool\n |
📋 Forensic Best Practices with WinAudit
- Always use portable version - Leaves no traces on examined system
- Run from write-protected media - Prevents accidental modification
- Generate signed PDF reports - Provides court-admissible evidence
- Document audit parameters - Record which categories and flags were used
- Verify hash values - Compare before and after audit to ensure no changes
- Use consistent command lines - Ensures reproducible results across cases
- Cross-reference findings - Validate with other forensic tools
- Maintain chain of custody - Document when and how audit was performed
🧠 Memory Forensics Tools
Tool 1: Volatility Framework – RAM Analysis
Volatility Framework is the world's most advanced open-source memory forensics framework. It analyzes RAM dumps to detect rootkits, fileless malware, hidden processes, and in-memory artifacts.
- Cross-platform (Windows, Linux, Mac memory dumps)
- Hundreds of analysis plugins
- Detects fileless malware and rootkits
- Extracts decrypted passwords and keys
- Command history reconstruction
- Network connection analysis
📌 Volatility Forensic Workflow
- Acquire memory dump (using FTK Imager, LiME, DumpIt, winpmem)
- Verify memory dump integrity using hash values (MD5/SHA256)
- Identify OS profile using imageinfo or windows.info plugin
- List running processes (pslist, psscan, psxview)
- Check for hidden/unlinked processes
- Analyze network connections and sockets (netscan, connections)
- Extract command history (cmdscan, consoles, cmdline)
- Scan for injected/malicious code (malfind, apihooks, hollowfind)
- Extract malware binaries for further analysis (procdump, moddump, memdump)
- Extract registry hives and analyze (hivelist, dumpregistry, hivedump)
- Create timeline of events (timeliner)
- Generate forensic report with findings
📥 Volatility Installation Guide
Option 1: Install on Kali Linux (APT)
# Update package list
sudo apt update
# Install Volatility 2 (legacy, still widely used)
sudo apt install volatility -y
# Verify installation
volatility --versionOption 2: Install Volatility 3 via Pip (Recommended)
# Install Python3 and pip if not present
sudo apt install python3 python3-pip -y
# Install Volatility 3
pip3 install volatility3
# Create alias for easier access
alias vol3='python3 -m volatility3'
# Verify installation
vol3 -hOption 3: Install from GitHub (Latest Development)
# Clone the repository
git clone https://github.com/volatilityfoundation/volatility3.git
# Navigate to directory
cd volatility3
# Run Volatility 3
python3 vol.py -h
# Install symbol tables (required for analysis)
python3 vol.py -f memory.dump windows.infoOption 4: Windows Installation (Standalone)
# Download standalone executable
https://www.volatilityfoundation.org/releases
# Extract to folder (e.g., C:\Volatility)
# Run from Command Prompt
volatility.exe -f memory.dump imageinfo📸 Memory Acquisition Methods
Windows Memory Acquisition
# Method 1: Using FTK Imager (GUI)
File → Add Evidence Item → Physical Drive → Select drive
File → Create Disk Image → RAW (dd) format → Select destination
# Method 2: Using DumpIt (Command Line)
# Run as Administrator
DumpIt.exe
# Method 3: Using winpmem (Open Source)
winpmem_2.1.exe output.mem
# Method 4: Using Magnet RAM Capture (Free)
# Download from Magnet Forensics website
# Run as Administrator, select capture locationLinux Memory Acquisition
# Method 1: Using LiME (Linux Memory Extractor)
git clone https://github.com/504ensicsLabs/LiME.git
cd LiME/src
make
insmod lime.ko "path=output.mem format=raw"
# Method 2: Using dd (limited, not recommended)
sudo dd if=/dev/mem of=memory.dump bs=1M
# Method 3: Using fmem (open source)
git clone https://github.com/NationalSecurityAgency/fmem.git
cd fmem
make
sudo insmod fmem.ko
sudo dd if=/dev/fmem of=memory.dump bs=1MmacOS Memory Acquisition
# Using osxpmem
sudo osxpmem -o output.mem
# Using Mac Memory Reader (free tool)
# Download from website, run as root⌨️ Basic Volatility Commands
Volatility 2 (Legacy)
# Step 1: Identify OS profile (ALWAYS do this first)
volatility -f memory.dump imageinfo
# Step 2: List running processes
volatility -f memory.dump --profile=Win10x64 pslist
# Step 3: List processes (scanning for hidden processes)
volatility -f memory.dump --profile=Win10x64 psscan
# Step 4: Cross-view process listing (find hidden processes)
volatility -f memory.dump --profile=Win10x64 psxview
# Step 5: Network connections
volatility -f memory.dump --profile=Win10x64 netscan
# Step 6: Command history (cmd.exe)
volatility -f memory.dump --profile=Win10x64 cmdscan
# Step 7: Console commands (PowerShell, cmd)
volatility -f memory.dump --profile=Win10x64 consoles
# Step 8: Extract malicious process memory
volatility -f memory.dump --profile=Win10x64 procdump -p [PID] -D output/
# Step 9: Detect injected code
volatility -f memory.dump --profile=Win10x64 malfind
# Step 10: Extract registry hives
volatility -f memory.dump --profile=Win10x64 hivelist
volatility -f memory.dump --profile=Win10x64 dumpregistryVolatility 3 (Modern)
# Step 1: Get system information (profile auto-detected)
vol3 -f memory.dump windows.info
# Step 2: List running processes
vol3 -f memory.dump windows.pslist
# Step 3: Scan for hidden processes
vol3 -f memory.dump windows.psscan
# Step 4: Network connections
vol3 -f memory.dump windows.netscan
# Step 5: Command line arguments for processes
vol3 -f memory.dump windows.cmdline
# Step 6: Extract process DLLs
vol3 -f memory.dump windows.dlllist
# Step 7: Scan for malware injections
vol3 -f memory.dump windows.malfind
# Step 8: Dump process memory
vol3 -f memory.dump windows.memdump --pid [PID] --dump
# Step 9: Extract registry hives
vol3 -f memory.dump windows.registry.hivelist
# Step 10: Create timeline of events
vol3 -f memory.dump windows.timeliner🎯 Practical Use Cases
Use Case 1: Malware Detection and Analysis
# Scenario: Suspicious system behavior, possible malware infection
# Step 1: Identify OS profile
volatility -f suspect.dump imageinfo
# Step 2: List all processes
volatility -f suspect.dump --profile=Win10x64 pslist > processes.txt
# Step 3: Find hidden processes (compare pslist vs psscan)
volatility -f suspect.dump --profile=Win10x64 psscan > psscan.txt
diff processes.txt psscan.txt
# Step 4: Check for process hollowing
volatility -f suspect.dump --profile=Win10x64 hollowfind
# Step 5: Scan for injected code
volatility -f suspect.dump --profile=Win10x64 malfind
# Step 6: Extract suspicious processes
volatility -f suspect.dump --profile=Win10x64 procdump -p [PID] -D malware_samples/
# Step 7: Check network connections for C2 communication
volatility -f suspect.dump --profile=Win10x64 netscan | grep -E "ESTABLISHED|CLOSE_WAIT"
# Step 8: Analyze extracted binaries with VirusTotal
# Upload malware_samples/*.exe to VirusTotal for detectionUse Case 2: Insider Threat Investigation
# Scenario: Employee suspected of data theft
# Step 1: Extract command history
volatility -f insider.dump --profile=Win10x64 cmdscan > cmd_history.txt
volatility -f insider.dump --profile=Win10x64 consoles > console_history.txt
# Step 2: Find file access evidence
volatility -f insider.dump --profile=Win10x64 filescan | grep -E "\.docx|\.xlsx|\.pdf|\.zip"
# Step 3: Extract USB device history
volatility -f insider.dump --profile=Win10x64 usbhistory
# Step 4: Check for recently accessed files
volatility -f insider.dump --profile=Win10x64 shellbags
# Step 5: Extract network shares accessed
volatility -f insider.dump --profile=Win10x64 netscan | grep "445"
# Step 6: Check for external drive connections
volatility -f insider.dump --profile=Win10x64 driverscan | grep -i "usb"
# Step 7: Extract registry for user activity
volatility -f insider.dump --profile=Win10x64 hivelist
volatility -f insider.dump --profile=Win10x64 printkey -K "Software\Microsoft\Windows\CurrentVersion\Explorer\RecentDocs"Use Case 3: Ransomware Investigation
# Scenario: Files encrypted, ransom note left on system
# Step 1: Identify suspicious process with high CPU/memory usage
volatility -f ransomware.dump --profile=Win10x64 pslist | sort -k4 -n
# Step 2: Check process command lines
volatility -f ransomware.dump --profile=Win10x64 cmdline
# Step 3: Find ransom note creation
volatility -f ransomware.dump --profile=Win10x64 filescan | grep -i "ransom\|readme\|decrypt"
# Step 4: Extract the ransomware process
volatility -f ransomware.dump --profile=Win10x64 procdump -p [PID] -D ransomware_sample/
# Step 5: Check for persistence mechanisms
volatility -f ransomware.dump --profile=Win10x64 printkey -K "Software\Microsoft\Windows\CurrentVersion\Run"
# Step 6: Analyze network connections (C2 communication)
volatility -f ransomware.dump --profile=Win10x64 netscan
# Step 7: Extract registry for encryption markers
volatility -f ransomware.dump --profile=Win10x64 printkey -K "Software\[RansomwareName]"Use Case 4: Fileless Malware Detection
# Scenario: Anti-virus not detecting malware, system still compromised
# Step 1: Scan for process hollowing (common fileless technique)
volatility -f fileless.dump --profile=Win10x64 hollowfind
# Step 2: Detect injected code in legitimate processes
volatility -f fileless.dump --profile=Win10x64 malfind
# Step 3: Check for API hooks
volatility -f fileless.dump --profile=Win10x64 apihooks
# Step 4: Analyze PowerShell event logs (often used for fileless)
volatility -f fileless.dump --profile=Win10x64 evtlogs
# Step 5: Extract PowerShell command history
volatility -f fileless.dump --profile=Win10x64 consoles | grep -i "powershell"
# Step 6: Check for reflective DLL injection
volatility -f fileless.dump --profile=Win10x64 ldrmodules
# Step 7: Look for callbacks (rootkit detection)
volatility -f fileless.dump --profile=Win10x64 callbacksUse Case 5: Password and Key Extraction
# Scenario: Need to recover decrypted passwords from memory
# Step 1: Extract registry hives
volatility -f target.dump --profile=Win10x64 hivelist
volatility -f target.dump --profile=Win10x64 dumpregistry
# Step 2: Extract SAM and SYSTEM hives for password hashes
volatility -f target.dump --profile=Win10x64 hashdump
# Step 3: Extract LSA secrets (service account passwords)
volatility -f target.dump --profile=Win10x64 lsadump
# Step 4: Extract cached domain credentials
volatility -f target.dump --profile=Win10x64 cachedump
# Step 5: Extract Wi-Fi passwords
volatility -f target.dump --profile=Win10x64 wlanprofiles
# Step 6: Extract browser saved passwords (requires additional tools)
# Dump Chrome/Edge process and extract using python scriptsUse Case 6: Incident Response Timeline Creation
# Scenario: Need to reconstruct attack timeline from memory
# Step 1: Generate comprehensive timeline
vol3 -f incident.dump windows.timeliner --output=csv --output-file=timeline.csv
# Step 2: Extract process creation times
vol3 -f incident.dump windows.pslist --output=csv > processes.csv
# Step 3: Extract network connection times
vol3 -f incident.dump windows.netscan --output=csv > network.csv
# Step 4: Extract file access times
vol3 -f incident.dump windows.filescan --output=csv > files.csv
# Step 5: Load all CSV files into Timeline Explorer or Excel
# Sort by timestamp to create chronological attack narrative
# Step 6: Identify attacker entry point (first suspicious process)
# Identify lateral movement (network connections to other hosts)
# Identify data exfiltration (file access + network uploads)🔧 Advanced Volatility Plugins
| Plugin | Purpose | Command |
|---|---|---|
| imageinfo / windows.info | Identify OS profile and memory layout\n | volatility -f dump imageinfo\n
|
| pslist / psscan | List active and hidden processes\n | vol -f dump windows.pslist\n
|
| netscan / connections | Network connections and listening ports\n | vol -f dump windows.netscan\n
|
| malfind / hollowfind | Detect injected code and process hollowing\n | vol -f dump windows.malfind\n
|
| cmdscan / consoles | Command history from cmd and PowerShell\n | vol -f dump windows.cmdline\n
|
| procdump / memdump | Extract process memory for analysis\n | vol -f dump windows.memdump --pid [PID]\n
|
| filescan / dumpfiles | Find and extract files from memory\n | vol -f dump windows.dumpfiles\n
|
| hivelist / dumpregistry | Extract registry hives from memory\n | vol -f dump windows.registry.hivelist\n
|
| timeliner / mftparser | Create forensic timeline\n | vol -f dump windows.timeliner\n
|
| apihooks / iat | Detect API hooking and rootkits\n | vol -f dump windows.apihooks\n
|
⚠️ Troubleshooting Common Issues
| Issue | Possible Cause | Solution |
|---|---|---|
| "No profile found" error | Unknown OS or corrupted memory dump\n | Use imageinfo --plugins; try manual profile specification\n
|
| Symbol table not found (Vol3) | Missing symbol files for specific Windows build\n | Run vol3 -f dump windows.info to download symbols\n
| Empty process list | Wrong profile or corrupted dump\n | Re-run imageinfo; verify memory dump hash\n | Slow analysis | Large memory dump (8GB+)\n | Use targeted plugins; increase RAM; use faster storage\n |
| Cannot find injected code | Sophisticated rootkit or anti-forensics\n | Use ldrmodules, modscan, threads plugins\n
|
📋 Forensic Best Practices for Memory Analysis
- Acquire memory first - Memory is volatile; capture before powering off
- Verify hash values - Document MD5/SHA256 before and after analysis
- Use write-blockers - Prevent accidental modification during acquisition
- Document profile detection - Record which profile was used for analysis
- Cross-reference findings - Validate with multiple plugins (pslist + psscan + psxview)
- Preserve extracted artifacts - Save dumped processes, registry hives, and files
- Update symbol tables - Keep Volatility updated for new Windows versions
- Maintain chain of custody - Document every analysis step
- Use timeline analysis - Correlate events across multiple plugins
- Combine with disk forensics - Memory findings should align with disk evidence
Memory analysis should only be performed on evidence you have legal authority to examine. RAM may contain decrypted passwords, private keys, and sensitive user data. Always maintain proper chain of custody and document all analysis steps.
Tool 2: Volatility Workbench – GUI for Volatility
Volatility Workbench provides a graphical user interface for the Volatility Framework, making memory forensics more accessible for beginners and professionals who prefer GUI environments.
- Point-and-click interface for Volatility commands
- Plugin management and execution
- Visualization of process trees
- Export results to CSV/HTML/JSON
- Profile detection helper
- Cross-platform (Windows, Linux, macOS via Python)
📥 Volatility Workbench Installation
Option 1: Windows Standalone (Recommended for Beginners)
# Step 1: Download from GitHub
https://github.com/volatilityfoundation/volatility-workbench/releases
# Step 2: Extract the ZIP file
# Step 3: Run VolatilityWorkbench.exe (no installation required)
# Step 4: Ensure Volatility is in PATH or configure location
# If Volatility not found, point to volatility.exe locationOption 2: Install with Python (Cross-platform)
# Install Volatility 3 first
pip3 install volatility3
# Install PyQt5 for GUI
pip3 install PyQt5
# Clone Workbench repository
git clone https://github.com/volatilityfoundation/volatility-workbench.git
cd volatility-workbench
# Run Workbench
python3 workbench.py🖥️ Volatility Workbench Interface Guide
Main Window Components
- Menu Bar - File, Plugins, View, Help
- Toolbar - Quick access to Load, Detect Profile, Run, Export
- Memory Image Panel - Display loaded memory dump information
- Profile Panel - OS profile selection (auto-detect or manual)
- Plugin Browser - Searchable list of all Volatility plugins
- Plugin Configuration Panel - Set plugin parameters (PID, output format)
- Results Viewer - Tabbed interface for viewing analysis results
- Process Tree View - Visual hierarchical view of processes
- Status Bar - Current operation status and progress
Step-by-Step GUI Analysis
- Launch Volatility Workbench.exe
- Click "Load Memory Image" → Browse to memory dump file
- Click "Detect Profile" to auto-identify OS (or select manually from dropdown)
- Browse plugins in left panel (organized by category)
- Double-click a plugin to run (e.g., "windows.pslist")
- View results in main panel (table format with sortable columns)
- Right-click on any result for additional options:
- Copy to Clipboard - Copy selected rows
- Export to CSV - Save as CSV file
- Dump Process Memory - Extract process for offline analysis
- Show Process Tree - Visualize parent-child relationships
- View Strings - Extract strings from process memory
- Use tabs to compare multiple plugin results side-by-side
- Save workspace: File → Save Workspace to resume later
🎯 Volatility Workbench Use Cases
Use Case 1: Quick Malware Triage
# Using Volatility Workbench for rapid malware detection:
1. Load memory dump
2. Detect profile automatically
3. Run "pslist" - look for suspicious process names
4. Run "netscan" - identify suspicious network connections
5. Run "malfind" - scan for code injection
6. Right-click suspicious process → "Dump Process Memory"
7. Export all results to CSV for documentation
8. Save workspace for later analysis
# Time: 5-10 minutes for initial triageUse Case 2: Visual Process Tree Analysis
# Understanding malware parent-child relationships:
1. Load memory dump in Workbench
2. Run "pslist" to get process list
3. Select a process in results
4. Click "Show Process Tree" button
5. View visual hierarchy showing:
- Parent processes (who launched the malware)
- Child processes (what malware launched)
- Suspicious relationships (e.g., Word spawning PowerShell)
6. Export process tree as image for reportUse Case 3: Batch Analysis with Plugin Chaining
# Running multiple plugins sequentially:
1. Load memory dump
2. Select first plugin (e.g., "windows.pslist")
3. Run and review results
4. Click "Add to Batch" button
5. Select second plugin (e.g., "windows.netscan")
6. Click "Add to Batch"
7. Continue adding plugins as needed
8. Click "Run Batch" to execute all sequentially
9. Results appear in separate tabs
10. Export all results with single "Export All" buttonUse Case 4: Training and Education
# Using Workbench for teaching memory forensics:
Advantages for training:
- No command line memorization required
- Visual feedback helps understanding
- Students can focus on concepts, not syntax
- Built-in help for each plugin
- Sample memory dumps available online
Teaching workflow:
1. Load training memory dump
2. Explain what each plugin does
3. Run plugin and discuss results
4. Compare Windows vs Linux memory dumps
5. Practice detecting suspicious artifacts📊 Comparing Volatility Workbench vs CLI
| Feature | Volatility Workbench (GUI) | Volatility CLI |
|---|---|---|
| Ease of learning | ✓ Easy, visual, no memorization | Steep learning curve, requires memorization |
| Speed of analysis | Slower (UI overhead) | ✓ Faster, direct execution |
| Automation | Limited (no scripting) | ✓ Full scripting support (bash, Python) |
| Process tree visualization | ✓ Built-in visual tree | Text-based only (pstree) |
| Remote analysis | Not supported (local only) | ✓ SSH, remote files, network shares |
| Plugin development | Not supported | ✓ Full access, write custom plugins |
| Large memory dumps (16GB+) | May be slow, memory intensive | ✓ Optimized, lower overhead |
| Training/Education | ✓ Excellent for beginners | Better for advanced users |
⚠️ Troubleshooting Volatility Workbench
| Issue | Possible Cause | Solution |
|---|---|---|
| "No Volatility installation found" | Volatility not installed or not in PATH | Install Volatility; set path in Settings → Volatility Path |
| Profile detection fails | Unknown OS or corrupted dump | Select profile manually from dropdown; verify dump integrity |
| Plugin returns no results | Wrong profile or plugin not applicable | Re-check profile; try alternative plugin (pslist vs psscan) |
| Application crashes on large dump | Insufficient RAM or memory leak | Use CLI version for large dumps; increase system RAM |
| Export button disabled | No results loaded yet | Run a plugin first to generate results |
📋 Best Practices for Volatility Workbench
- Use for triage and training - Quick analysis, learning environment
- Switch to CLI for large cases - Better performance for 16GB+ dumps
- Save workspaces - Preserve analysis state for later review
- Export results immediately - Save CSV files before closing
- Verify profile detection - Double-check with multiple plugins
- Combine with CLI when needed - Use Workbench for quick look, CLI for deep dive
- Update regularly - Check for new versions and plugin updates
Memory analysis should only be performed on evidence you have legal authority to examine. RAM may contain sensitive information including passwords, encryption keys, and personal data. Always maintain proper chain of custody and document all analysis steps.
Tool 3: LiME – Linux Memory Extractor
LiME (Linux Memory Extractor) is a Loadable Kernel Module (LKM) that captures volatile memory from Linux systems. It is the preferred tool for Linux memory acquisition in forensic investigations.
- Captures full RAM content
- Minimally invasive to the target system
- Supports local and remote acquisition
- Compresses output to save space
- Compatible with Volatility analysis
📌 LiME Forensic Workflow
- Compile LiME kernel module for target system
- Copy LiME module to target system
- Load module with acquisition parameters
- Capture memory to file or network
- Unload module
- Hash and preserve memory dump
📌 LiME Installation and Compilation
1️⃣ Clone Repository
git clone https://github.com/504ensicsLabs/LiME.git2️⃣ Install Build Dependencies
sudo apt install build-essential linux-headers-$(uname -r) -y3️⃣ Compile LiME
cd LiME/src
make
📌 Basic LiME Commands
Capture memory to local file
sudo insmod lime.ko "path=/tmp/memory.dump format=lime"Capture memory to remote host
sudo insmod lime.ko "path=tcp:4444 format=lime"Capture memory with compression
sudo insmod lime.ko "path=/tmp/memory.dump format=lime compress=1"Unload LiME module
sudo rmmod limeMemory acquisition should only be performed on systems you own or have explicit legal authorization.
🌐 Network Forensics Tools
Tool 1: Wireshark – Packet Analysis
Wireshark is the world's most popular network protocol analyzer. It captures and examines network packets in real-time or from saved PCAP files.
- Supports hundreds of protocols
- Live capture and offline analysis
- Powerful display filters
- Follow TCP/UDP/HTTP streams
- Extract files from network traffic
- Statistical analysis and graphs
📌 Wireshark Forensic Workflow
- Capture traffic from network interface
- Save PCAP file for later analysis
- Apply display filters to focus on suspicious traffic
- Follow streams to reconstruct conversations
- Extract files and artifacts
- Export filtered results for reporting
📌 Wireshark Installation
1️⃣ Install on Kali Linux
sudo apt install wireshark -y2️⃣ Install on Windows
https://www.wireshark.org/download.html📌 Basic Wireshark Display Filters
# Capture filters (before capture)
tcp port 80 # HTTP traffic only
host 192.168.1.100 # Specific IP
not arp # Exclude ARP traffic
# Display filters (during analysis)
http.request.method == "POST" # POST requests
dns.qry.name contains "malware" # Suspicious DNS
ip.src == 192.168.1.100 # Source IP
tcp.port == 443 # HTTPS traffic
tcp.flags.syn == 1 and tcp.flags.ack == 0 # SYN scans
frame.time >= "2024-01-01" # Time filter
http.response.code == 404 # Not found responses
dns.flags.response == 0 # DNS queries only
ssl.handshake.type == 1 # SSL/TLS Client Hello
arp.duplicate-address-detected # ARP spoofing detectionNetwork traffic capture should only be performed on networks you own or have explicit legal authorization.
Tool 2: tcpdump – CLI Packet Capture
tcpdump is a powerful command-line packet capture tool available on most Unix-like systems. It is ideal for headless servers and remote captures.
- Lightweight and efficient
- Runs on any Linux/Unix system
- Can capture and save PCAP files
- Filtering similar to Wireshark
- Ideal for remote capture via SSH
📌 tcpdump Installation
sudo apt install tcpdump -y📌 Basic tcpdump Commands
# Capture all traffic on interface
tcpdump -i eth0
# Capture to file
tcpdump -i eth0 -w capture.pcap
# Capture and read file
tcpdump -r capture.pcap
# Capture specific host traffic
tcpdump host 192.168.1.100 -w host.pcap
# Capture HTTP traffic only
tcpdump port 80 -w http.pcap
# Capture with size limit (100MB)
tcpdump -C 100 -G 3600 -w capture-%Y%m%d_%H%M%S.pcap
# Capture with count limit (1000 packets)
tcpdump -c 1000 -w sample.pcap
# Capture and display in ASCII
tcpdump -A -i eth0
# Verbose output
tcpdump -v -i eth0
# Capture without DNS resolution (faster)
tcpdump -n -i eth0Network traffic capture should only be performed on networks you own or have explicit legal authorization.
Tool 3: NetworkMiner – PCAP Analysis
NetworkMiner is a Network Forensic Analysis Tool (NFAT) that extracts files, images, emails, and credentials from PCAP files without requiring deep packet analysis knowledge.
- Extracts files and images from PCAP
- Reconstructs emails and attachments
- Identifies host operating systems
- Extracts credentials and sessions
- Visual network mapping
- No packet decoding expertise required
📌 NetworkMiner Installation
1️⃣ Download from Official Website
https://www.netresec.com/?page=NetworkMiner2️⃣ Extract and Run
Extract archive
Run NetworkMiner.exe (Windows) or
mono NetworkMiner.exe (Linux/Mac)📌 Basic NetworkMiner Usage
# Load PCAP file
File → Open → Select capture.pcap
# View extracted files
Files tab → View and export extracted files
# View reconstructed images
Images tab → View all extracted images
# View credentials
Credentials tab → Extracted usernames/passwords
# View host information
Hosts tab → OS detection and open ports
# Export all extracted data
File → Export → Select export optionsPCAP analysis should only be performed on evidence you have legal authority to examine.
📱 Mobile Forensics Tools
Tool 1: Cellebrite UFED – Mobile Extraction
Cellebrite UFED (Universal Forensic Extraction Device) is the industry standard for mobile device forensics. It is used by law enforcement agencies worldwide for physical extraction, locked device bypass, and app decoding.
- Physical extraction from thousands of devices
- Locked device bypass capabilities
- Decodes over 15,000 app versions
- Cloud extraction (iCloud, Google, Samsung)
- Advanced reporting features
- Court-admissible evidence format
📌 Cellebrite UFED Workflow
- Isolate device from network (Faraday bag)
- Document device condition (photographs, status)
- Connect device to UFED hardware/software
- Select extraction method (logical, file system, physical)
- Bypass lock screen if needed
- Extract data and generate report
- Hash verification and chain of custody
📌 Extraction Methods
| Method | Description | Data Retrieved |
|---|---|---|
| Logical Extraction | Backup-based extraction via iTunes/ADB | Contacts, messages, call logs, photos, settings |
| File System Extraction | Full file system access (requires root/jailbreak) | All logical data + databases, app data, deleted records |
| Physical Extraction | Chip-off, JTAG, ISP (advanced forensic methods) | Complete memory image including deleted data |
Mobile device extraction should only be performed with proper legal authorization (warrant or consent).
Tool 2: Oxygen Forensic Detective
v17.1.0.131 (Enterprise) – Crack VersionOxygen Forensic ® Detective is an industry‑leading mobile forensic platform that extracts, decodes, and analyzes data from smartphones, cloud services, drones, and IoT devices. It provides deep artifact decoding, application analysis, and advanced reporting — essential for law enforcement, corporate investigations, and eDiscovery.
- Supports 35,000+ device profiles and 450+ app artifacts (WhatsApp, Signal, Telegram, etc.)
- Cloud extraction from iCloud, Google, Huawei, and Samsung backups
- Advanced logical, file system, and physical acquisition (including encrypted devices)
- AI‑based face recognition and biometric decoding
- Built‑in SQLite, Plist, and timeline analysis with intuitive dashboards
📌 Typical Forensic Workflow (Oxygen Forensic Detective)
- Install the main application (Dongle / installer package)
- Apply patch files (replace core components with authorized modifications for lab testing)
- Retrieve Hardware ID from the running software
- Use VMProtect license generator (keygen project) to produce a valid license file (
oxy.lic) - Place generated license & finalize activation → full forensic analysis
- Create case, acquire device/cloud, and generate expert reports
Install core software using the OxyDetective_Dongle_x64_Setup_17.1.0.131.exe package. This is the main forensic platform.
- Locate setup archive:
OxyDetective_Dongle_x64_Setup_17.1.0.131.rar→ extract contents (WinRAR). - Run
OxyDetective_dongle_x64_Setup_17.1.0.131.exeas Administrator (right‑click → Run as administrator). - The installer extracts temporary files (progress indicator). Click Next / Install when prompted.
- Choose Destination folder: default is
C:\Program Files\Oxygen Forensics\Oxygen Forensic Detective.- Optionally create desktop shortcut.
- Select Program language (English recommended).
- Review and Accept the license agreement → Click Install.
- Wait for completion → final screen shows "Oxygen Forensic Detective is successfully installed!"
- Uncheck “Launch” for now (do not run yet) → click Finish.
%ProgramFiles%\Oxygen Forensics\Oxygen Forensic Detective.
Required disk space: ~3.5 GB (additional space for cases).
The PatchFiles package replaces key binaries and DLLs to enable full functionality (educational lab context). Administrator rights are required to write into Program Files.
- Extract
OxyDetective_PatchFiles_x64_Setup_17.1.0.131.rar→ folderOxyDetective_PatchFiles_x64_Setup_17.1.0.131. - Inside you'll find folders and files: Dev, Map, OFE, CKE, and several
.dll/.execomponents (e.g., CKEngine.dll, OxyDetective.exe, OxyCheck64.dll, etc.) - Open the installation directory:
C:\Program Files\Oxygen Forensics\Oxygen Forensic Detective - Copy all patched files/folders from the extracted PatchFiles folder into the installation directory, overwriting when prompted.
- If “Destination Folder Access Denied” appears (as seen in lab environments):
- Click Continue with admin consent, or use “Do this for all current items” → provide administrator permission.
- Alternatively, take ownership: right‑click install folder → Properties → Security → Advanced → Change owner to Administrators.
- Verify critical patched files (example):
CKEngine.dll,OxyDetective.exe,DeviceExtractor.dllare replaced/updated. - Recommended: after patching, restart the system to apply driver‑level changes.
| Component / Folder | Purpose | Size indicator |
|---|---|---|
| Dev / Map / OFE / CKE | License validation bypasses and extended module patches | ~ 1.5 MB – 8 MB |
| CKEngine.dll | Core cryptographic & licensing engine (patched) | ~15,287 KB |
| OxyCheck64.dll | Integrity checks (modified to accept custom license) | ~15,300 KB |
| OxyDetective.exe (main) | Primary forensic application executable | ~31,568 KB |
| OxyCDRExpert64 | Cloud & device extraction module | ~16,241 KB |
Oxygen Forensic Detective v17.1 uses a Hardware‑ID (HWID) based licensing system. To generate a valid license, we extract the HWID from the target machine and use the keygen project inside VMProtect Ultimate.
- Launch Oxygen Forensic Detective (after patching). The application shows a Hardware ID dialog (see lab screenshot).
- Copy the Hardware ID string (example):
nljhdbXQuihnhgG4vtdhD8uEGOnVcCKli3uP34E610= - Paste the HWID into a text document (Notepad) for later use. Preserve exact Base64 format.
- Keep the application open (or note that HWID is bound to the current machine).
- From the
OxyDetective_keygen_x64_Setup_17.1.0.131folder, locate Oxygen 17.1 keygen.vmp (VMProtect project). - Launch VMProtect Ultimate v3.6.0 (registered version) → click Open → select
Oxygen 17.1 keygen.vmpfile. - In the VMProtect interface, navigate to Project → Licenses → Add License.
- Fill license details (according to provided screenshot evidence):
- Customer Name:
GSMSCENE(or any desired name) - Email: (optional, e.g., training@forensiclab.com)
- Hardware ID: Paste the previously copied HWID
- Expiration Date: Set to
25/01/2025(or any future date) - Running Time Limit: 0 (unlimited) or optional 30 minutes
- Max Build Date: 26/12/2025
- Customer Name:
- Click Add License → VMProtect generates a unique Serial Number (Base64 long string).
- Go to the Licenses tab → Right‑click the new license → Export license file → Save as
oxy.lic(LIC format). - Alternatively, copy the serial number and manually create a license file using provided template.
oxy.lic license file is generated and cryptographically bound to the specific Hardware ID. Save it in a secure location.
Place the generated license file into the appropriate directory so Oxygen Forensic Detective recognizes it as a valid enterprise license. Then launch and verify.
- Copy the generated
oxy.licfile to the installation root folder:
C:\Program Files\Oxygen Forensics\Oxygen Forensic Detective\or under%PROGRAMDATA%\Oxygen Forensics\Licenses\(depending on version). Create theLicensesfolder if necessary. - Ensure the license file is readable and not corrupted.
- Right‑click
oxy.lic→ Properties → make sure it's not blocked by Windows. - Launch Oxygen Forensic Detective as Administrator. The application will read the license and activate full features.
- Confirm activation: the main dashboard appears with no “Hardware ID” or “Trial expired” messages.
- Navigate to Help → About → License information should show Licensed to: GSMSCENE and expiration date.
- Run a test extraction (e.g., load a logical backup or connect a test device) to ensure all modules (Cloud Extractor, KeyScout, Device Extractor) are functional.
| Component | Expected Behavior | Status indicator |
|---|---|---|
| Oxygen Forensic® Detective main UI | Launches without HWID popup, full menus visible | Active |
| Device Extractor / Cloud Extractor | Can acquire data from iCloud/Android backups | Licensed |
| KeyScout (portable acquisition) | Add to removable media option enabled | Ready |
| Reports & export | All report formats (HTML, PDF, XLSX) accessible | Full access |
MD5 (oxy.lic) = 3e6c9b1a8f4d2e5c7a8b9c0d1e2f3a4bAlways compute hash of license files for evidence chain-of-custody when deploying in forensic labs.
| Field | Description | Example value (from lab) |
|---|---|---|
| Customer Name | Identifier embedded in license, visible in About box | GSMSCENE |
| Hardware ID | Unique ID of target workstation (prevents license sharing) | nljhdbXQuihnhgG4vtdhD8uEGOnVcCKli3uP34E610= |
| Expiration Date | License validity end date (DD/MM/YYYY format) | 25/01/2025 |
| Running Time Limit | Session timeout in minutes (0 = unlimited) | 0 (unlimited) |
| Max Build Date | Prevents usage on newer versions beyond this date | 26/12/2025 |
| Serial Number (generated) | Cryptographically signed string that is validated by the license engine | Long Base64 (above example) |
oxy.lic file must be present in the install path each time the application launches.
| Step | Purpose | Key artifacts / tools | Output |
|---|---|---|---|
| Step 1 | Base installation (dongle setup) | Setup executable, WinRAR, Admin rights | Oxygen Detective core directory |
| Step 2 | Apply patch files & bypass integrity | PatchFiles archive, DLL overwrite, admin prompts | Modified binaries, no dongle check |
| Step 3 | HWID extraction & license generation | VMProtect Ultimate, keygen.vmp project, oxy.lic | Custom license bound to HWID |
| Step 4 | License activation & validation | oxy.lic placement, client launch | Fully unlocked forensic suite |
The techniques shown (patching, keygen use, VMProtect license generation) are intended exclusively for authorized forensic training, reverse engineering research, and analysis of software protection mechanisms in controlled lab environments. Unauthorized usage, software cracking, or circumvention of license agreements violates intellectual property laws. Always obtain proper licensing from Oxygen Forensics for production or real‑case usage. This documentation is for educational purposes only.
In this lab, you will acquire a physical/logical image from an Android or iOS device, parse application artifacts, and generate a forensic report using Oxygen Forensic Detective. This replicates real‑world mobile forensic casework.
- Oxygen Forensic Detective v17.1 activated (Lab 1–4 completed)
- Test mobile device (Android 10+ or iOS 14+) or a forensic backup file (iTunes/ADB)
- USB debugging enabled (Android) / forensic pairing (iOS)
- Write blocker / airplane mode recommended to preserve evidence integrity
Enable Developer Options & USB Debugging (Android)
Before connecting an Android device for forensic acquisition, you must enable Developer Options and USB debugging.
- On the Android device, go to Settings → About Phone.
- Scroll to “Build Number” and tap it 7 times rapidly. You will see a toast: “You are now a developer!”
- Go back to Settings → System → Developer Options (or directly under Settings on some devices).
- Toggle “Developer Options” ON at the top.
- Scroll down and enable “USB debugging” – confirm any security warning.
- Optional but recommended: Enable “USB tethering” (used for network‑based acquisitions or ADB over network).
Note USB tethering may be under Settings → Network & Internet → Hotspot & Tethering. - On some devices, also enable “Stay awake” (screen won’t sleep while charging) to avoid interruptions.
Step A – Connect & Detect Device
- Launch Oxygen Forensic Detective as Administrator.
- Connect the mobile device via USB (use original cable, avoid hubs).
- From the main dashboard, click “New case” → enter case name (e.g.,
Mobile_Lab_2025) and examiner details. - Select acquisition source:
- Device – for physical/logical extraction from live device
- Backup import – iTunes, ADB, Samsung Smart Switch, etc.
- Cloud – iCloud or Google account (requires credentials)
- Choose “Android” or “iOS” and follow on‑screen prompts to enable USB debugging (Android) or accept trust dialog (iOS).
- Wait for the tool to identify device model, OS version, and security patch level.
Step B – Perform Forensic Acquisition
- Click “Acquire” and select extraction level:
- Logical – contacts, messages, media, call logs (fast, non‑invasive)
- File system – deeper access to app sandboxes, databases, deleted artifacts (requires root/checks)
- Physical – full bit‑wise image (advanced, requires specific chip‑off or bootloader access)
- For this lab, choose Logical + File System (if supported).
- Select which artifact categories to extract: Messages (SMS/MMS) Call logs Contacts Installed apps WiFi history Chat apps (WhatsApp, Signal, Telegram)
- Enable hash verification (MD5/SHA‑256) and evidence packaging.
- Click “Start extraction”. The progress bar will show parsing of databases and file system.
- Wait for completion (duration depends on device size).
Step C – Artifact Analysis & Timeline Review
- Navigate to the “Dashboard” → view executive summary: number of contacts, messages, app artifacts.
- Go to “Messages” tab → filter by WhatsApp/Telegram.
- Examine deleted messages (via SQLite WAL/journal analysis).
- Export chat history as PDF/HTML for reporting.
- Open “Communications” → call logs with duration and associated contacts.
- Use “Locations” module to plot GPS coordinates on a map:
- Extracted from photos, Wi‑Fi access points, or app metadata.
- Identify significant places (home, work) using clustering.
- Explore “Application Analysis”:
App Category Artifacts Found Forensic Value Messaging (WhatsApp) Chats, media, contact list, deleted messages Conversation evidence, timestamps Browser (Chrome) History, bookmarks, downloads User activity, searches Social (Instagram) Direct messages, posts, profile info Social interactions Email (Gmail) Cached emails, attachments Correspondence evidence - Use the “Timeline” view (default sorting by timestamp) to reconstruct user activity hour‑by‑hour.
Step D – Generate Forensic Report
- Click “Reports” → “Create Report”.
- Select report format: PDF HTML XLSX (timeline) CSV (raw tables)
- Choose which sections to include (e.g., Device Info, Messages, Call Logs, Locations, Bookmarks).
- Add case number, examiner name, and digital signature.
- Click “Generate” and save the report to your case folder.
- Verify hash of the report for court‑readiness.
Examiner: J. Doe | Case: Mobile_Lab_2025 | Acquisition date: 2025-04-29
Device: Samsung Galaxy S21, Android 13
Total messages: 4,523 (124 deleted)
WhatsApp conversations: 12 groups, 8 individual chats
Key location: 37.7749° N, 122.4194° W (visited 4 times during incident window)
- Device not detected – reinstall USB drivers, change cable, restart Oxygen Detective.
- USB debugging not sticking – revoke authorizations on device and re‑allow.
- iOS extraction requires pairing – use “Trust this computer” and provide screen lock passcode.
- Encrypted backups (Android) – obtain screen lock code or use ADB backup with known password.
Tool 3: Magnet AXIOM – Unified Digital Investigation Platform
Magnet AXIOM is a comprehensive digital investigation platform that combines computer, mobile, and cloud forensics with advanced artifact categorization and visual timeline reporting.
- Unified computer, mobile, and cloud forensics
- Artifact categorization by user activity
- Visual timeline reconstruction
- Automated artifact extraction
- Cloud evidence collection
- Court-ready reporting
📥 Complete Installation Guide
1️⃣ System Requirements
| Component | Minimum | Recommended |
|---|---|---|
| OS | Windows 10 Pro/Enterprise | Windows 11 Pro/Enterprise |
| Processor | Intel Core i5 (6th gen+) | Intel Core i7/i9 or Xeon (8+ cores) |
| RAM | 16 GB | 32-64 GB |
| Storage | 500 GB SSD | 1-2 TB NVMe SSD + separate evidence drive |
| GPU | Integrated | Dedicated GPU with 4GB+ VRAM |
2️⃣ Download Magnet AXIOM
# Official website
https://www.magnetforensics.com/products/magnet-axiom/
# Download options:
- AXIOM Process (evidence processing)
- AXIOM Examine (review and reporting)
- AXIOM Cyber (enterprise/remote acquisition)
# Free trial available (14 days, full features)3️⃣ Installation Steps
- Run the installer as Administrator (
Magnet_AXIOM_Setup.exe) - Select components to install:
- ✓ AXIOM Process (required)
- ✓ AXIOM Examine (required)
- ✓ Magnet Agent (for remote acquisitions)
- ✓ AXIOM Cloud (cloud evidence collection)
- Choose installation directory (SSD recommended)
- Select evidence storage location (separate drive recommended)
- Complete installation and restart if prompted
- Activate license (or start trial)
4️⃣ Post-Installation Configuration
# Update artifact definitions
Help → Check for Updates → Download latest artifacts
# Configure processing defaults
Tools → Options → Processing → Set default artifact categories
# Set evidence storage paths
Tools → Options → Storage → Set case and evidence locations
# Configure cloud credentials (if needed)
Tools → Options → Cloud → Add accounts (Google, Microsoft, Apple)📂 Step-by-Step: Creating a New Investigation Case
1️⃣ Launch AXIOM Process
- Open Magnet AXIOM Process from Start Menu
- Click "New Case" or "Create New Case"
- Enter Case Name (e.g., "Corporate_Investigation_2024")
- Enter Case Number (e.g., "INV-2024-001")
- Enter Examiner Name and Agency
- Add Case Description and Notes
- Select Case Folder Location (evidence drive)
- Click "Create Case"
2️⃣ Add Evidence Sources
Click "Add Evidence" and select from these source types:
| Evidence Type | Description | Supported Formats |
|---|---|---|
| Disk Image | Forensic images of hard drives/SDDs | E01, Ex01, DD, RAW, AFF, VMDK, VHD, VHDX, QCOW2 |
| Local Drive | Physical or logical drive access | Physical disk, Volume, Folder |
| Mobile Device | iOS and Android devices | Logical extraction, Full file system, Advanced logical |
| Cloud Evidence | Cloud service accounts | Google, Microsoft 365, Apple iCloud, Dropbox, Box |
| Memory Dump | RAM captures | RAW, ELF, Mach-O, WinPmem |
| PCAP | Network captures | PCAP, PCAPNG |
3️⃣ Select Artifact Categories
AXIOM organizes artifacts by category. Select relevant categories for your investigation:
- File System
- Registry Analysis
- Email (Outlook, Thunderbird)
- Browser History
- Chat Logs
- Download History
- USB Device History
- Recently Used Documents
- Contacts & Call Logs
- SMS/MMS Messages
- WhatsApp / Telegram / Signal
- Photos & Videos
- GPS Locations
- App Usage
- Wi-Fi Connections
- Social Media
- Google Drive Files
- OneDrive Files
- iCloud Data
- Email Messages
- Calendar Events
- Contacts
- Chat History
- Cloud Storage
4️⃣ Configure Processing Options
- De-duplication - Remove duplicate files based on hash
- Hash Analysis - Compare against known good/bad hash sets
- Carving - Recover deleted files (requires more time)
- OCR - Extract text from images (slower but thorough)
- Language Identification - Detect language of text artifacts
- Translation - Auto-translate foreign language artifacts
5️⃣ Run Processing
- Click "Process" to start evidence processing
- Monitor progress in Processing Status window
- Processing time varies based on evidence size (minutes to hours)
- When complete, click "Examine Evidence" to launch AXIOM Examine
🔍 AXIOM Examine - Reviewing Findings
Main Interface Components
- Artifact Explorer (Left Panel) - Categorized findings by artifact type
- Content Viewer (Center Panel) - Detailed artifact information
- Timeline (Bottom Panel) - Chronological visualization
- Relationship View - Connections between artifacts (people, places, devices)
- Tagging Panel - Bookmark and categorize evidence
- Search Bar - Global keyword search across all artifacts
Artifact Categorization Views
| Category | Subcategories | Forensic Value |
|---|---|---|
| People | Contacts, Chat participants, Email senders | Identify persons of interest |
| Conversations | Chats, Emails, SMS | Communication analysis |
| Timeline | All artifacts by date/time | Event reconstruction |
| Locations | GPS coordinates, Wi-Fi locations | Movement tracking |
| Devices | USB drives, connected devices | Data transfer evidence |
| Accounts | User accounts, cloud accounts | Identity attribution |
🔧 Advanced Features in Magnet AXIOM
📊 1. Visual Timeline Analysis
- Click "Timeline" tab at bottom
- Use zoom slider to adjust time granularity (seconds to years)
- Filter by artifact type (Messages, Files, Locations, etc.)
- Filter by source (Computer, Mobile, Cloud)
- Click any event to view details
- Drag to select time range for detailed analysis
- Right-click events to bookmark or tag
🔗 2. Relationship Analysis
- Click "Relationships" tab
- View network graph of connections between artifacts
- Nodes represent: People, Devices, Locations, Accounts, Files
- Click any node to see connected artifacts
- Double-click node to view all related evidence
- Export relationship graph as image for reports
🔍 3. Advanced Search
- Click "Search" in top toolbar
- Enter keywords (supports Boolean: AND, OR, NOT)
- Use filters:
- Artifact type (Email, Chat, File, etc.)
- Date range
- Source device
- User account
- Use regular expressions for pattern matching
- Save searches for reuse across cases
- Export search results as CSV
🏷️ 4. Tagging and Bookmarking
- Select any artifact in Content Viewer
- Click "Tag" button or right-click → Tag
- Choose tag type:
- Suspicious - Potentially relevant
- Important - Key evidence
- Exculpatory - Clears suspect
- Notable - Interesting finding
- Custom - Create your own
- Add comments explaining relevance
- View all tagged items in "Tags" panel
📄 5. Report Generation
- Click "Report" button in toolbar
- Select Report Template:
- Standard Forensic Report - Complete case documentation
- Executive Summary - High-level findings for non-technical
- Timeline Report - Focus on chronological events
- Artifact Report - Specific artifact categories only
- Select sections to include:
- ✓ Case information
- ✓ Evidence sources and processing details
- ✓ Timeline visualization
- ✓ Relationship graph
- ✓ Tagged/bookmarked artifacts
- ✓ Search results
- ✓ Artifact summaries by category
- Choose output format (PDF, DOCX, HTML, CSV)
- Click "Generate Report"
📱 Mobile Device Forensics with AXIOM
Supported Mobile Devices
- iOS Devices - iPhone, iPad, iPod Touch (iOS 7 through latest)
- Android Devices - Most manufacturers (Samsung, Google, OnePlus, LG, Motorola)
- Legacy Devices - BlackBerry, Windows Phone (limited support)
Mobile Acquisition Methods
| Method | Description | Requirements |
|---|---|---|
| Logical Extraction | Extracts user-accessible data (contacts, messages, photos) | USB cable, device unlocked, USB debugging (Android) |
| Full File System (Android) | Extracts entire file system (including app data) | Root access or advanced logical (some devices) |
| Advanced Logical (iOS) | Extracts more data than standard logical (requires backup) | iTunes backup password (optional) |
| Physical Extraction (limited) | Bit-for-bit image of device storage | Chip-off, JTAG, ISP (advanced hardware) |
Step-by-Step Mobile Acquisition
- In AXIOM Process, click "Add Evidence" → "Mobile Device"
- Select device type (iOS or Android)
- Connect device via USB cable (use write-blocker if available)
- Enable Developer Mode (Android) or trust computer (iOS)
- Select acquisition type (Logical recommended for most cases)
- Select artifacts to acquire:
- Contacts, Call Logs, SMS/MMS
- Photos, Videos, Audio
- App data (WhatsApp, Signal, Telegram)
- Browser history, Wi-Fi connections
- GPS locations, App usage
- Click "Acquire" to start extraction
- Review extracted data in AXIOM Examine
☁️ Cloud Forensics with AXIOM
Supported Cloud Services
- Microsoft 365 - Email, OneDrive, Teams, SharePoint
- Google Workspace - Gmail, Drive, Calendar, Chat
- Apple iCloud - Photos, Contacts, Calendar, Notes
- Dropbox - Files, Sharing, Activity
- Box - Files, Collaboration
- Social Media - Facebook, Twitter, Instagram, LinkedIn (limited)
Cloud Acquisition Methods
- In AXIOM Process, click "Add Evidence" → "Cloud"
- Select cloud service (e.g., Google Workspace)
- Enter authentication credentials (requires legal authorization)
- Select date range for collection
- Select artifacts to collect:
- Emails and attachments
- Cloud storage files
- Calendar events
- Contacts
- Chat messages
- Login and audit logs
- Click "Acquire" to collect evidence
- Review collected data in AXIOM Examine
🎯 Practical Analysis Examples
Example 1: Timeline Reconstruction for Incident
# Step 1: Process all evidence (computer, mobile, cloud)
# Step 2: Open Timeline view in AXIOM Examine
# Step 3: Set incident time window
Timeline → Filter → Date Range → Enter incident dates
# Step 4: Filter by artifact type
Select: Messages, Files, Locations, Calls
# Step 5: Identify suspicious activity
Look for:
- Files created/modified during incident window
- Messages sent/received at unusual times
- Location movements correlating with incident
- Deleted artifacts around incident time
# Step 6: Bookmark relevant events
Right-click → Tag → Important → Add commentExample 2: Communication Analysis
# Step 1: Navigate to Conversations view
Click "Conversations" in Artifact Explorer
# Step 2: Review all communication channels
- SMS/MMS messages
- WhatsApp chats
- Email threads
- Social media messages
# Step 3: Search for keywords
Search → Enter keywords (e.g., "password", "meeting", "confidential")
# Step 4: Identify communication patterns
- Frequent contacts
- Communication times
- Sentiment analysis (available in AXIOM)
# Step 5: Export communication timeline
Right-click conversation → Export → CSVExample 3: Cross-Device Correlation
# Step 1: Process all evidence sources
Add: Computer image, Mobile extraction, Cloud data
# Step 2: Open Relationships view
Click "Relationships" tab
# Step 3: Identify common entities
Look for:
- Same phone number across devices
- Same email address
- Same GPS coordinates
- Same Wi-Fi networks
# Step 4: Follow connections
Click on a person node → See all communications across devices
# Step 5: Build complete picture
Use relationship graph to understand how devices and people are connectedExample 4: Data Exfiltration Investigation
# Step 1: Identify USB device usage
Artifact Explorer → Devices → USB History
Note: Device serial number, first/last connection
# Step 2: Find accessed files on USB
Artifact Explorer → File System → USB drive
Review file access timestamps
# Step 3: Check cloud uploads
Artifact Explorer → Cloud → Drive activity
Look for file uploads matching USB file timestamps
# Step 4: Review email for sent attachments
Artifact Explorer → Email → Sent items
Search for emails with attachments matching file names
# Step 5: Create timeline of data movement
Timeline view → Filter by file names → Chronological view🏢 AXIOM Cyber - Enterprise Investigations
Remote Acquisition Capabilities
- Magnet Agent - Lightweight agent deployed to remote endpoints
- Triaging - Collect only relevant artifacts to reduce data volume
- Live Acquisition - Collect evidence from running systems
- Memory Capture - Acquire RAM from remote systems
- Automated Collection - Schedule collections across multiple endpoints
Deploying Magnet Agent
# Step 1: Create collection manifest in AXIOM Process
File → New Collection → Select artifacts to collect
# Step 2: Deploy agent (multiple methods)
- Group Policy (GPO) deployment
- SCCM deployment
- Manual installation
- PowerShell remote deployment
# Step 3: Execute collection
Agent runs silently in background
Collects only selected artifacts
Uploads to network share or AXIOM server
# Step 4: Import collected data
Add Evidence → Magnet Agent Collection → Import .MAGNET file⚠️ Troubleshooting Common Issues
| Issue | Possible Cause | Solution |
|---|---|---|
| Processing very slow | Insufficient RAM, HDD instead of SSD | Add more RAM; move case to SSD; reduce artifact selection |
| Mobile device not detected | Driver issue, USB cable, device locked | Install device drivers; use OEM cable; unlock device |
| Cloud authentication fails | MFA required, expired token, incorrect credentials | Use app password; refresh token; verify credentials |
| Memory acquisition fails | Insufficient permissions, antivirus blocking | Run as Administrator; disable AV temporarily |
| Cannot open evidence file | Corrupted image, unsupported format | Verify hash; convert using FTK Imager |
| Timeline empty | No artifacts with timestamps processed | Re-process with timeline-relevant artifacts selected |
📋 Forensic Best Practices with Magnet AXIOM
- Always update artifacts before processing new cases (weekly updates)
- Use separate evidence drives for case files (not system drive)
- Verify hash values before and after processing
- Document processing parameters for reproducibility
- Use triage processing for large evidence to reduce time
- Export raw artifacts for backup before tagging
- Cross-validate findings with another forensic tool
- Maintain chain of custody in case notes within AXIOM
- Use relationship view to discover hidden connections
- Generate reports early to identify missing artifacts
AXIOM Workflow Summary
- Create new case in AXIOM Process
- Add evidence sources (disk images, mobile, cloud, memory dumps)
- Select artifact categories to process
- Run processing (automated artifact extraction)
- Review findings in AXIOM Examine
- Build timeline and visualize relationships
- Bookmark relevant artifacts
- Generate forensic report
⌨️ Useful Keyboard Shortcuts
| Shortcut | Action |
|---|---|
| Ctrl+N | New Case |
| Ctrl+O | Open Case |
| Ctrl+S | Save Case |
| Ctrl+F | Search |
| Ctrl+Shift+F | Advanced Search |
| Ctrl+T | Tag Selected Item |
| Ctrl+E | Export Selected |
| Ctrl+R | Generate Report |
Magnet AXIOM should only be used on evidence you have legal authority to examine. Mobile and cloud acquisitions require proper legal authorization (warrant, subpoena, or consent). Always maintain chain of custody and document all actions in case notes.
Tool 4: Exterro – E-Discovery & Forensic Workflow
Exterro is an E-Discovery and digital forensics workflow platform that helps organizations manage legal hold, data preservation, and forensic investigations at scale.
- Legal hold management
- Data preservation and collection
- Forensic workflow automation
- Chain of custody tracking
- Integration with forensic tools
- Compliance reporting
📌 Exterro Use Cases
- Legal Hold: Preserve relevant evidence for litigation
- Data Collection: Collect from custodians and data sources
- Forensic Workflow: Manage forensic examinations
- Early Case Assessment: Quickly identify relevant data
- Compliance: Ensure regulatory compliance (GDPR, HIPAA, etc.)
Exterro should only be used for legitimate legal and compliance purposes with proper authorization.
🔐 Password & Hash Cracking Tools
Tool 1: John the Ripper – Password Cracking
John the Ripper (JtR) is a fast password cracker available for many operating systems. It supports hundreds of hash types and multiple attack modes.
- Supports hundreds of hash types
- Wordlist, incremental, and rule-based attacks
- Highly configurable
- Supports GPU acceleration
- Distributed cracking support
📌 John the Ripper Installation
sudo apt install john -y📌 Basic John the Ripper Commands
# Crack NTLM hash
john --format=nt hash.txt
# Use wordlist attack
john --wordlist=rockyou.txt hashes.txt
# Use rules
john --wordlist=rockyou.txt --rules hashes.txt
# Show cracked passwords
john --show hashes.txt
# Test performance
john --test
# Crack Linux shadow file
unshadow /etc/passwd /etc/shadow > hashes.txt
john hashes.txt
# Crack ZIP file
zip2john file.zip > hash.txt
john hash.txt
# Crack RAR file
rar2john file.rar > hash.txt
john hash.txt
Password cracking without authorization may violate computer fraud laws.
Tool 2: Hashcat – GPU-Accelerated Cracking
Hashcat is the world's fastest password recovery tool, leveraging GPU acceleration for high-speed password cracking. It supports over 300 hash types.
- GPU acceleration (NVIDIA, AMD, Intel)
- Supports 300+ hash types
- Multiple attack modes (mask, wordlist, rules, brute-force)
- Distributed cracking support
- Cross-platform (Windows, Linux, macOS)
📌 Hashcat Installation
sudo apt install hashcat -y📌 Basic Hashcat Commands
# List hash types
hashcat --help | grep -i "ntlm"
# Common hash types:
# -m 1000 : NTLM
# -m 5600 : NetNTLMv2
# -m 0 : MD5
# -m 100 : SHA1
# -m 1400 : SHA256
# Crack NTLM hash
hashcat -m 1000 -a 0 hashes.txt rockyou.txt
# Crack with mask attack (8-character alphanumeric)
hashcat -m 1000 -a 3 ?l?l?l?l?l?l?l?l
# Crack with rules
hashcat -m 1000 -a 0 hashes.txt rockyou.txt -r rules/best64.rule
# Show cracked passwords
hashcat -m 1000 hashes.txt --show
# Benchmark GPU
hashcat -b
# Save output
hashcat -m 1000 hashes.txt rockyou.txt -o cracked.txtPassword cracking should only be performed on hashes from evidence you have legal authority to access.
📂 File Carving & Recovery Tools
Tool 1: Foremost – File Carving
Foremost is a powerful file carving tool that recovers files based on their headers, footers, and internal data structures. It is effective for recovering deleted files from unallocated space.
- Recovers files without file system metadata
- Supports multiple file types (JPEG, PDF, ZIP, etc.)
- Configurable file signatures
- Efficient for large disk images
- Open source and free
📌 Foremost Installation
sudo apt install foremost -y📌 Basic Foremost Commands
# Carve all supported file types
foremost -i image.dd -o output_directory
# Carve specific file types
foremost -t jpg,pdf,zip -i image.dd -o output_directory
# Use custom configuration file
foremost -c foremost.conf -i image.dd -o output_directory
# Verbose output
foremost -v -i image.dd -o output_directory
# Carve from raw disk
foremost -i /dev/sda -o output_directoryTool 2: PhotoRec – Multi-Format Recovery
PhotoRec is a file carving tool designed to recover lost files from digital camera memory, hard disks, and CD-ROMs. It recovers over 480 file extensions.
- Recovers 480+ file types
- Works on unallocated space
- Supports all major file systems
- Free and open source
- Runs on Windows, Linux, macOS
📌 PhotoRec Installation
sudo apt install testdisk -y📌 Basic PhotoRec Commands
# Launch PhotoRec
photorec
# From command line (non-interactive)
photorec /dev/sda1
# Recover to specific directory
photorec /dev/sda1 /path/to/recovery/
# File formats are selected interactivelyTool 3: Scalpel – Configurable Carving
Scalpel is a fast file carving tool that uses highly configurable file signature definitions. It is optimized for speed and can carve large disk images efficiently.
- Extremely fast carving
- Highly configurable signatures
- Optimized for large images
- Multi-threaded support
- Less false positives than Foremost
📌 Scalpel Installation
sudo apt install scalpel -y📌 Basic Scalpel Commands
# Edit configuration file
sudo nano /etc/scalpel/scalpel.conf
# Run scalpel
scalpel -c scalpel.conf -o output image.dd
# Carve with custom config
scalpel -c custom.conf -o output image.dd
# Verbose output
scalpel -c scalpel.conf -o output -v image.ddTool 4: Binwalk – Firmware & Embedded File Analysis
Binwalk is a powerful, open-source firmware analysis tool designed to identify and extract embedded files and executable code from within binary images. It is widely used in IoT forensics, router firmware analysis, malware analysis, and file carving. Binwalk scans binary files for known file signatures (magic bytes) and extracts embedded content for further analysis.
- Identifies embedded file systems (SquashFS, JFFS2, CramFS, ext2/3/4)
- Extracts embedded executables, compressed archives, and firmware images
- Uses recursive extraction to unpack nested archives
- Supports entropy analysis to detect encrypted or compressed data
- Integrates with IDA Pro and Ghidra for reverse engineering
- Cross-platform (Linux, Windows, macOS)
- Open-source and actively maintained
📥 Installation Guide
Ubuntu / Kali Linux / Debian
# Install from official repositories
sudo apt update
sudo apt install binwalk -y
# Install from GitHub (latest version)
git clone https://github.com/ReFirmLabs/binwalk.git
cd binwalk
sudo python setup.py install
# Install additional extraction dependencies
sudo apt install -y mtd-utils gzip bzip2 tar arj lzop lzma cabextractWindows Installation
# Method 1: Using Python pip
pip install binwalk
# Method 2: Download Windows executable
# https://github.com/ReFirmLabs/binwalk/releases
# Method 3: Using WSL (Windows Subsystem for Linux)
wsl --install
sudo apt install binwalk -ymacOS Installation
# Using Homebrew
brew install binwalk
# Using Python pip
pip3 install binwalkbinwalk --version
📚 Understanding Binwalk Capabilities
What Binwalk Detects
| Category | File Types | Forensic Value |
|---|---|---|
| File Systems | SquashFS, JFFS2, CramFS, ext2/3/4, FAT, NTFS, HFS+ | Extract complete file systems from firmware |
| Compressed Archives | ZIP, RAR, 7z, GZIP, BZIP2, XZ, TAR, LZMA, ARJ, CAB | Recover compressed payloads and files |
| Executable Code | ELF, PE (EXE/DLL), Mach-O, COFF, a.out | Identify malware binaries in firmware |
| Linux Kernels | Linux kernel images (vmlinux, zImage, uImage) | Extract kernel for vulnerability analysis |
| Bootloaders | U-Boot, RedBoot, GRUB, LILO | Identify bootloader vulnerabilities |
| File Signatures | JPEG, PNG, PDF, ELF, PE, ZIP, TAR, and 100+ more | File carving and type identification |
Binwalk Architecture
┌─────────────────────────────────────────────────────────────────────────────┐
│ BINWALK ARCHITECTURE │
├─────────────────────────────────────────────────────────────────────────────┤
│ │
│ ┌─────────────────────────────────────────────────────────────────────┐ │
│ │ Magic Signature Database │ │
│ │ ┌─────────────┐ ┌─────────────┐ ┌─────────────┐ ┌─────────────┐ │ │
│ │ │ File System │ │ Compression │ │ Executable │ │ Archive │ │ │
│ │ │ Signatures │ │ Signatures │ │ Signatures │ │ Signatures │ │ │
│ │ └─────────────┘ └─────────────┘ └─────────────┘ └─────────────┘ │ │
│ └─────────────────────────────────────────────────────────────────────┘ │
│ │ │
│ ▼ │
│ ┌─────────────────────────────────────────────────────────────────────┐ │
│ │ Scanning Engine │ │
│ │ • Entropy Analysis (detect encrypted/compressed data) │ │
│ │ • Signature Matching (identify known file types) │ │
│ │ • Recursive Extraction (extract nested content) │ │
│ └─────────────────────────────────────────────────────────────────────┘ │
│ │ │
│ ▼ │
│ ┌─────────────────────────────────────────────────────────────────────┐ │
│ │ Output Formats │ │
│ │ • Console (human-readable) • JSON (machine-readable) │ │
│ │ • CSV (spreadsheet) • XML (structured data) │ │
│ └─────────────────────────────────────────────────────────────────────┘ │
│ │
└─────────────────────────────────────────────────────────────────────────────┘
⌨️ Basic Binwalk Commands
Command Structure
binwalk [OPTIONS] FILEEssential Commands Reference
| Command | Description | Use Case |
|---|---|---|
binwalk firmware.bin |
Scan and display found signatures | Quick assessment of file contents |
binwalk -e firmware.bin |
Extract embedded files | Recover files from firmware |
binwalk -Me firmware.bin |
Extract recursively (extract nested files) | Deep extraction of all embedded content |
binwalk -D "type:ext" file.bin |
Extract specific file types | Targeted extraction (e.g., only ZIP files) |
binwalk -E firmware.bin |
Entropy analysis | Detect encrypted/compressed regions |
binwalk -W file1.bin file2.bin |
Compare two binary files | Identify similarities between files |
binwalk -R "\x00\x01\x02" file.bin |
Search for raw byte sequence | Find specific byte patterns |
🎯 Practical Forensic Use Cases
Use Case 1: Router Firmware Analysis
# Step 1: Download router firmware from manufacturer
wget https://example.com/firmware.bin
# Step 2: Scan for embedded file systems
binwalk firmware.bin
# Sample output:
# DECIMAL HEXADECIMAL DESCRIPTION
# 0 0x0 TRX firmware header, little endian, ...
# 104 0x68 LZMA compressed data, properties: 0x5D
# 1310720 0x140000 SquashFS filesystem, little endian
# Step 3: Extract the SquashFS file system
binwalk -e -d 2 firmware.bin
# Step 4: Analyze extracted file system
ls -la _firmware.bin.extracted/
cd squashfs-root/
ls -la
# Step 5: Look for sensitive files
find . -name "*.cfg" -o -name "*.conf" -o -name "*.passwd"
find . -name "*.bin" -o -name "*.elf"Use Case 2: Malware Analysis – Extracting Payloads
# Step 1: Scan suspicious binary for embedded files
binwalk malware_sample.exe
# Step 2: Extract all embedded files
binwalk -e malware_sample.exe
# Step 3: Recursive extraction (for nested archives)
binwalk -Me malware_sample.exe
# Step 4: Examine extracted files
file _malware_sample.exe.extracted/*
strings _malware_sample.exe.extracted/* | head -50
# Step 5: Check for encrypted sections using entropy analysis
binwalk -E malware_sample.exe
# Step 6: Extract only PE executables
binwalk -D "Microsoft executable:exe" malware_sample.exeUse Case 3: File Carving from Unallocated Space
# Step 1: Extract unallocated space from forensic image
dls -l image.dd > unallocated.dd
# Step 2: Scan unallocated space for recoverable files
binwalk unallocated.dd
# Step 3: Carve all recoverable files
binwalk -e unallocated.dd
# Step 4: Extract specific file types (PDFs and ZIPs)
binwalk -D "PDF document:pdf" -D "Zip archive:zip" unallocated.dd
# Step 5: Review carved files
ls -la unallocated.dd.extracted/Use Case 4: IoT Device Forensics
# Step 1: Extract firmware from IoT device (via JTAG or direct flash read)
# Step 2: Scan for file systems
binwalk iot_firmware.bin
# Step 3: Extract root file system
binwalk -e iot_firmware.bin
# Step 4: Analyze configuration files
cd _iot_firmware.bin.extracted/squashfs-root/
cat etc/passwd
cat etc/shadow
cat etc/config/*
# Step 5: Extract binary executables for reverse engineering
find . -type f -executable -exec file {} \;
binwalk -D "ELF executable:elf" iot_firmware.bin
# Step 6: Check for hardcoded credentials
grep -r "password" ./
grep -r "api_key" ./
grep -r "token" ./Use Case 5: UEFI/BIOS Firmware Analysis
# Step 1: Extract BIOS/UEFI firmware from system
# Using tools like UEFITool or direct dump
# Step 2: Scan for UEFI volumes and modules
binwalk bios_firmware.bin
# Step 3: Extract UEFI firmware components
binwalk -e bios_firmware.bin
# Step 4: Identify PE executables (UEFI drivers)
binwalk -D "Microsoft executable:efi" bios_firmware.bin
# Step 5: Analyze extracted modules for vulnerabilities
strings _bios_firmware.bin.extracted/*.efi | grep -i "smm\|secureboot\|nvram"⚡ Advanced Binwalk Options
Entropy Analysis (Detect Encryption/Compression)
# Generate entropy plot (requires matplotlib)
binwalk -E firmware.bin
# Entropy signatures:
# - High entropy (close to 1.0) → Encrypted or compressed
# - Low entropy (close to 0.0) → Raw data or plaintext
# - Medium entropy (0.5-0.7) → Executable code or structured dataBinary Comparison
# Compare two binary files (identify similarities)
binwalk -W file1.bin file2.bin
# Output shows matching bytes (green) and differences (red)Raw Byte Sequence Search
# Search for specific hex patterns
binwalk -R "\x00\x01\x02\x03\x04" firmware.bin
# Search for ASCII string pattern
binwalk -R "secretkey" firmware.binCustom Magic Signature File
# Create custom magic file (magic.txt)
# Format: offset description type [value]
# Example:
# 0 string CUSTOMPKG Custom Package Header
# 4 lelong 0x12345678 Version marker
# Use custom magic file
binwalk -m magic.txt firmware.binOutput Formats
# JSON output (for programmatic analysis)
binwalk -f output.json firmware.bin
binwalk -j firmware.bin # Alternative JSON output
# CSV output (for spreadsheet analysis)
binwalk -f output.csv firmware.bin
# Log file with detailed output
binwalk -l binwalk.log firmware.bin📦 Extraction Options Deep Dive
Extraction Flags
| Flag | Description | Example |
|---|---|---|
-e, --extract |
Extract known file types | binwalk -e firmware.bin |
-M, --matryoshka |
Recursive extraction (extract nested files) | binwalk -Me firmware.bin |
-d, --depth |
Limit recursion depth | binwalk -Me -d 2 firmware.bin |
-D, --dd |
Extract specific file types | binwalk -D "zip:zip" firmware.bin |
-r, --rm |
Delete carved files after extraction | binwalk -e -r firmware.bin |
-C, --directory |
Specify output directory | binwalk -e -C output_dir firmware.bin |
Extraction Workflow Examples
# Basic extraction
binwalk -e firmware.bin
# Recursive extraction with depth limit (prevents infinite recursion)
binwalk -Me -d 3 firmware.bin
# Extract only ZIP files
binwalk -D "zip archive:zip" firmware.bin
# Extract to specific directory
binwalk -e -C /path/to/output/ firmware.bin
# Extract and delete original carved files (save space)
binwalk -e -r firmware.bin🔗 Integration with Other Forensic Tools
Binwalk + IDA Pro / Ghidra
# Step 1: Extract embedded executables
binwalk -D "ELF executable:elf" firmware.bin
# Step 2: Load extracted binary into IDA Pro or Ghidra
# Step 3: Analyze for backdoors, vulnerabilities, or malwareBinwalk + QEMU (Emulation)
# Step 1: Extract firmware file system
binwalk -e firmware.bin
# Step 2: Mount extracted root file system
sudo mount -o loop _firmware.bin.extracted/rootfs.ext2 /mnt/firmware
# Step 3: Emulate with QEMU
qemu-system-arm -M versatilepb -kernel vmlinux -append "root=/dev/sda" -hda rootfs.ext2Binwalk + Firmadyne (IoT Emulation)
# Step 1: Extract firmware with binwalk
binwalk -Me firmware.bin
# Step 2: Use Firmadyne to emulate the firmware
./firmadyne/scripts/extractor.py -b -np firmware.bin
./firmadyne/scripts/tar2db.py -i -f firmware.tar.gzBinwalk + Volatility (Memory Forensics)
# Step 1: Extract embedded files from memory dump
binwalk -e memory.dmp
# Step 2: Use Volatility on the original dump
vol -f memory.dmp windows.pslist
# Step 3: Correlate extracted artifacts with Volatility findings⚠️ Troubleshooting Common Issues
| Issue | Possible Cause | Solution |
|---|---|---|
| "No signatures found" | File is encrypted, packed, or custom format | Run entropy analysis (-E), try different magic database |
| "Extraction failed" | Missing extraction tools (7z, unrar, etc.) | Install dependencies: sudo apt install p7zip-full unrar |
| "Recursion depth exceeded" | Deeply nested archives or infinite recursion | Use -d flag to limit depth: binwalk -Me -d 5 file.bin |
| "Memory error on large file" | File too large (>2GB) for default settings | Use --dd for targeted extraction, or split the file |
| "Signature database outdated" | New file formats not recognized | Update binwalk or custom magic file |
📋 Forensic Best Practices for Binwalk
- Always work on forensic copies - Never run binwalk directly on original evidence
- Document extraction parameters - Record which flags and options were used
- Verify extracted files - Use file command and hash verification
- Check for encrypted sections - Use entropy analysis (
-E) to identify encrypted/compressed data - Use recursive extraction - Many firmware images contain nested archives
- Correlate with other tools - Combine with strings, hexdump, and disassemblers
- Maintain chain of custody - Document all extraction steps for court admissibility
- Update magic signatures - Regularly update binwalk for new file format detection
- Use sandboxed environment - Extract unknown firmware in isolated VM
- Preserve original timestamps - Use
--preserveflag when available
📋 Quick Reference Card
# Quick scan
binwalk firmware.bin
# Extract all files
binwalk -e firmware.bin
# Recursive extraction (deep)
binwalk -Me firmware.bin
# Entropy analysis (detect encryption)
binwalk -E firmware.bin
# Extract specific file types
binwalk -D "zip:zip" -D "elf:elf" firmware.bin
# Compare two binaries
binwalk -W file1.bin file2.bin
# Search for byte pattern
binwalk -R "\x00\x01\x02\x03" firmware.bin
# JSON output (for scripting)
binwalk -j firmware.bin > output.json
# Custom magic file
binwalk -m custom.magic firmware.binELF Header: 7F 45 4C 46
PE Header: 4D 5A
ZIP Header: 50 4B 03 04
SquashFS: 68 73 71 73
JFFS2: 85 19 02 20
CramFS: 45 3D CD 28binwalk -Me (Matryoshka + Extract) for the most thorough extraction of nested archives and embedded file systems.
Binwalk should only be used on firmware and files you have legal authority to analyze. Many firmware files contain proprietary code subject to copyright. Always obtain proper authorization before analyzing third-party firmware.
Tool 5: Bulk Extractor – High-Speed Forensic Feature Extraction
Bulk Extractor is a powerful digital forensics tool that rapidly extracts features such as email addresses, URLs, IP addresses, credit card numbers, and other structured data from disk images, directory trees, and individual files. It is designed for speed and efficiency, processing large forensic images without mounting or fully parsing the file system.
- Extremely fast – processes terabytes of data in hours, not days
- Scans raw disk images without file system dependency
- Extracts email addresses, URLs, IPs, credit cards, SSNs, and more
- Multi-threaded for maximum performance (uses all CPU cores)
- Supports custom regex patterns for specific data types
- Outputs results in easy-to-analyze text and CSV formats
- Lightweight and runs on minimal hardware
📥 Installation
Ubuntu / Kali Linux / Debian
# Install bulk_extractor from repositories
sudo apt update
sudo apt install bulk-extractor -y
# Verify installation
bulk_extractor -VWindows / macOS
# Download from official GitHub
https://github.com/simsong/bulk_extractor/releases
# Extract and run from command line
bulk_extractor.exe -o output image.E01⌨️ Basic Bulk Extractor Commands
Basic Usage
# Scan a forensic image and output results to directory
bulk_extractor "/home/kali/Desktop/EO1/terry-work-usb-2009-12-11 (4).E01" -o /home/kali/Desktop/EO2/Advanced Command Options
| Goal | Command |
|---|---|
| Scan specific byte range (to save time) | bulk_extractor -o output -Y 0-1000000000 image.E01 |
| Speed up analysis (use 8 CPU cores) | bulk_extractor -o output -j 8 image.E01 |
| Search for a specific pattern (e.g., SSNs) | bulk_extractor -o output -f "[0-9]{3}-[0-9]{2}-[0-9]{4}" image.E01 |
| Disable a specific scanner (e.g., Email) | bulk_extractor -o output -x email image.E01 |
| Wipe previous results (start fresh) | bulk_extractor -o output -Z image.E01 |
| Scan a directory of files (not an image) | bulk_extractor -o output -R /path/to/folder/ |
🔍 Available Scanners
| Scanner | Description | Output File |
|---|---|---|
| Extracts email addresses | email.txt |
|
| url | Extracts URLs and domains | url.txt |
| ip | Extracts IPv4 and IPv6 addresses | ip.txt |
| ccn | Extracts credit card numbers | ccn.txt |
| ssn | Extracts Social Security Numbers | ssn.txt |
| telephone | Extracts phone numbers | telephone.txt |
| gps | Extracts GPS coordinates | gps.txt |
| aes | Finds AES encryption keys | aes.txt |
| base64 | Extracts base64 encoded data | base64.txt |
🎯 Practical Examples
Example 1: Extract All Email Addresses and URLs from Forensic Image
# Run bulk_extractor on the forensic image
bulk_extractor -o /home/kali/Desktop/EO2/ /home/kali/Desktop/EO1/terry-work-usb-2009-12-11\ \(4\).E01
# View extracted emails
cat /home/kali/Desktop/EO2/email.txt
# View extracted URLs
cat /home/kali/Desktop/EO2/url.txtExample 2: Multi-Threaded Scan for Faster Processing
# Use 8 CPU cores for parallel processing
bulk_extractor -o output -j 8 large_image.E01Example 3: Extract Specific Byte Range (Time-Saving)
# Scan only the first 1GB of a large image
bulk_extractor -o output -Y 0-1000000000 large_image.E01Example 4: Custom Pattern Search for Social Security Numbers
# Search for SSN pattern (XXX-XX-XXXX)
bulk_extractor -o output -f "[0-9]{3}-[0-9]{2}-[0-9]{4}" image.E01Example 5: Disable Specific Scanners
# Disable email and URL scanners (focus on other data)
bulk_extractor -o output -x email -x url image.E01Example 6: Scan a Directory of Files (Not an Image)
# Recursively scan all files in a directory
bulk_extractor -o output -R /path/to/evidence/folder/Example 7: Clear Previous Results Before New Scan
# Wipe existing output directory before starting
bulk_extractor -o output -Z image.E01📄 Output Files Generated by Bulk Extractor
| File | Contents | Use Case |
|---|---|---|
email.txt |
All extracted email addresses | Identify communication partners, potential phishing |
url.txt |
URLs and domains found | C2 communication, malicious sites, download sources |
ip.txt |
IP addresses (v4 and v6) | Attacker infrastructure, geolocation, threat intel |
ccn.txt |
Credit card numbers (Luhn validated) | Financial fraud evidence, data breach impact |
ssn.txt |
Social Security Numbers | PII exposure, identity theft evidence |
telephone.txt |
Phone numbers | Contact information, potential co-conspirators |
wordlist.txt |
Dictionary of found words | Password cracking, keyword analysis |
Tool 6: fiwalk – File System Walk & Metadata Extraction
fiwalk is a powerful command-line tool from the Sleuth Kit suite that walks through a forensic image and extracts detailed file system metadata, including file names, paths, timestamps, sizes, and inode information. It outputs results in XML or JSON format for further analysis.
- Extracts complete file system metadata from forensic images
- Outputs machine-readable XML/JSON for automated processing
- Integrates with The Sleuth Kit (TSK) for deep file system analysis
- Recovers deleted file entries with metadata
- Handles multiple file systems (NTFS, FAT, EXT, HFS+)
- Ideal for creating file inventories for large investigations
📥 Installation
# Install sleuthkit (includes fiwalk)
sudo apt install sleuthkit -y
# Verify installation
fiwalk -V⌨️ Basic fiwalk Commands
Basic Usage
# Generate XML report from forensic image
fiwalk -f -X report.xml image.E01
Common Options
| Option | Description | Example |
|---|---|---|
-f |
Process all files (including deleted) | fiwalk -f image.E01 |
-X |
Output as XML to specified file | fiwalk -X output.xml image.E01 |
-c |
Output as CSV to specified file | fiwalk -c output.csv image.E01 |
-p |
Print progress information | fiwalk -p image.E01 |
-m |
Output in bodyfile format | fiwalk -m bodyfile.txt image.E01 |
🎯 Practical Examples
Example 1: Generate XML Report for Forensic Image
# Generate XML report including deleted files
fiwalk -f -X report.xml /home/kali/Desktop/EO1/terry-work-usb-2009-12-11\ \(4\).E01Example 2: Generate CSV for Excel Analysis
# Generate CSV file for easy import into Excel
fiwalk -c file_inventory.csv image.E01Example 3: Process Multiple Images
# Process all E01 files in a directory
for img in /path/to/images/*.E01; do
fiwalk -X "${img%.E01}.xml" "$img"
doneExample 4: Combine with bulk_extractor
# First extract metadata with fiwalk
fiwalk -X metadata.xml image.E01
# Then extract features with bulk_extractor
bulk_extractor -o output image.E01
# Correlate findings between metadata and extracted data📋 Understanding fiwalk XML Output
<?xml version="1.0" encoding="UTF-8"?>
<dfxml xmloutputversion="1.0">
<metadata>
<image_filename>image.E01</image_filename>
<acquisition_timestamp>2024-01-15T10:30:00</acquisition_timestamp>
</metadata>
<fileobject>
<filename>secret_document.docx</filename>
<filesize>123456</filesize>
<modification_time>2024-01-14T09:00:00</modification_time>
<inode>54321</inode>
<hashdigest type="md5">a1b2c3d4e5f67890...</hashdigest>
</fileobject>
</dfxml>Tool 7: identify_filenames.py – Filename Mapping Tool
identify_filenames.py is a Python script that maps extracted data from tools like bulk_extractor back to specific files in the forensic image. It uses fiwalk XML output to correlate found artifacts (emails, URLs, etc.) with the files that contained them, providing critical context for forensic analysis.
- Correlates extracted features with source files
- Uses fiwalk XML output for file system context
- Helps investigators understand which files contained suspicious data
- Outputs mapped results for further analysis
- Essential for evidence attribution and timeline reconstruction
🔧 Usage
Basic Syntax
identify_filenames.py --image_filename <image.E01> --xmlfile <report.xml> <output_folder> <mapped_output>Example Command
# Run identify_filenames.py with fiwalk XML output
identify_filenames.py --image_filename image.E01 --xmlfile report.xml output_folder mapped_outputComplete Workflow Example
# Step 1: Generate fiwalk XML report
fiwalk -f -X file_metadata.xml image.E01
# Step 2: Run bulk_extractor to find artifacts
bulk_extractor -o bulk_output/ image.E01
# Step 3: Map extracted artifacts back to files
identify_filenames.py --image_filename image.E01 --xmlfile file_metadata.xml bulk_output/ mapped_output/📊 Complete Forensic Workflow
Forensic Image
E01/DD/RAWfiwalk
XML Metadatabulk_extractor
Features (email, URL, etc.)identify_filenames.py
Mapped ResultsAnalysis
EvidenceThese tools should only be used on evidence you have legal authority to examine. Always maintain proper chain of custody and document all analysis steps.
🕵️ Steganography & Metadata Tools
Tool 1: Steghide – Embed/Extract
Steghide is a steganography tool that hides data in JPEG, BMP, WAV, and AU files with optional AES-256 encryption.
- Supports JPEG, BMP, WAV, AU formats
- AES-256 encryption of hidden data
- Compression of hidden data
- Password protection
- Cross-platform
📌 Steghide Installation
sudo apt install steghide -y📌 Basic Steghide Commands
# Hide data
steghide embed -cf cover.jpg -ef secret.txt -p password123
# Extract data
steghide extract -sf stego.jpg -p password123
# Get file information
steghide info stego.jpg
# List supported algorithms
steghide encinfo
# Embed with compression
steghide embed -cf cover.jpg -ef secret.txt -p password123 -ZSteganography tools should only be used for legitimate purposes with proper authorization.
Tool 2: Zsteg – PNG LSB Detection
Zsteg is a steganography detection tool specifically designed to detect LSB (Least Significant Bit) steganography in PNG and BMP images.
- Detects LSB steganography in PNG files
- Supports multiple bit planes
- Extracts hidden data automatically
- Fast and lightweight
- Ruby-based
📌 Zsteg Installation
sudo gem install zsteg📌 Basic Zsteg Commands
# Detect LSB steganography
zsteg image.png
# Detect all bit planes
zsteg -a image.png
# Extract hidden data
zsteg -E "1,LSB,RGB" image.png > extracted.txt
# Verbose output
zsteg -v image.png
# Check specific channel
zsteg -b 1 -c r image.png
Tool 3: ExifTool – Metadata Analysis
ExifTool is the most comprehensive metadata reader/writer, supporting hundreds of file formats including images, documents, audio, and video files.
- Supports 100+ file formats
- Reads/writes EXIF, IPTC, XMP, GPS, and more
- Command-line and GUI versions
- Can remove or modify metadata
- Extract thumbnails and previews
📌 ExifTool Installation
sudo apt install exiftool -y📌 Basic ExifTool Commands
# Read all metadata
exiftool image.jpg
# Read specific tags
exiftool -Make -Model -DateTimeOriginal image.jpg
# Read GPS data
exiftool -GPS* image.jpg
# Extract thumbnail
exiftool -b -ThumbnailImage image.jpg > thumb.jpg
# Remove all metadata
exiftool -all= image.jpg
# Export to JSON
exiftool -j image.jpg > metadata.json
# Find files with GPS data
exiftool -GPS* -r /path/to/photos/
Tool 4: Metadata2Go – Online Metadata Viewer
Metadata2Go is a free online tool that extracts and displays metadata from various file types including images, documents, audio files, and videos.
- No installation required
- Supports many file types
- Export to JSON, CSV, HTML
- Quick and easy to use
- Free of charge
📌 How to Use Metadata2Go
1. Visit https://www.metadata2go.com/
2. Click "Choose File" or drag and drop your file
3. Click "View Metadata"
4. Review extracted metadata
5. Download metadata report (JSON, CSV, or HTML)Tool 5: Pic2Map – GPS Metadata Mapper
Pic2Map is a specialized online tool that extracts GPS coordinates from image metadata and displays them on an interactive map.
- Extracts GPS coordinates from EXIF data
- Interactive map display (Google Maps/OpenStreetMap)
- Address reverse lookup
- Batch processing support
- Export to KML/KMZ for Google Earth
📌 How to Use Pic2Map
1. Visit https://www.pic2map.com/
2. Upload image file (drag and drop or file picker)
3. Tool automatically extracts GPS coordinates
4. View exact location on interactive map
5. Export location data for case documentation
📄 Reporting & E-Discovery Tools
Tool 1: Forensic Reporting Best Practices
A forensic report is the official record of an investigation. It must be clear, complete, and legally defensible.
📋 Report Structure
- Executive Summary: High-level findings for non-technical readers
- Case Information: Case number, investigator, authorization, dates
- Evidence Inventory: List of examined files with hash values (MD5/SHA256)
- Methodology: Tools and techniques used (with version numbers)
- Chain of Custody: Documentation of evidence handling
- Findings: Detailed results with evidence references
- Timeline: Chronological reconstruction of events
- Limitations: What couldn't be determined
- Conclusion: Fact-based conclusions
- Appendices: Raw data, logs, screenshots, hash values
📋 Report Must Include
- Case information and scope of investigation
- Evidence hash values (MD5/SHA256) for verification
- Complete chain of custody documentation
- Methodology and tools used (with versions)
- Findings with clear evidence references
- Limitations and assumptions clearly stated
- Peer review and legal review documentation
Tool 2: Exterro – Legal Hold & E-Discovery
Exterro streamlines legal hold, data preservation, and discovery workflows for forensic investigations and litigation support.
📌 Key Features
- Legal Hold Management: Preserve relevant evidence for litigation
- Data Collection: Collect from custodians and data sources
- Forensic Workflow: Manage forensic examinations
- Chain of Custody: Track evidence handling
- Compliance Reporting: Ensure regulatory compliance
- Integration: Works with forensic tools like FTK and EnCase
Exterro should only be used for legitimate legal and compliance purposes with proper authorization.
Tool 3: Magnet AXIOM – Reporting & Visualization
Magnet AXIOM provides visual timelines, artifact categorization, and court-ready reporting for forensic investigations.
📌 Key Reporting Features
- Visual Timelines: Graphical timeline of user and system activity
- Artifact Categorization: Artifacts organized by user activity type
- Relationship Mapping: Visual connections between people, devices, and communications
- Customizable Reports: Executive, technical, and legal report templates
- Export Formats: PDF, HTML, CSV, and load files for legal review
- Bookmarking: Tag relevant artifacts for inclusion in reports
📌 Report Generation Workflow
- Complete analysis and bookmark relevant artifacts
- Navigate to Reporting module
- Select report template (Executive, Technical, or Legal)
- Choose artifacts to include
- Add case information and examiner notes
- Generate report in desired format
- Review and finalize for court submission
Resource 1: HexEd.it – Online Hex Editor
HexEd.it is a powerful browser-based hex editor that allows forensic investigators to analyze, edit, and inspect binary files directly in their web browser without any installation. It is an essential tool for examining file headers, footers, and raw binary data.
- No installation required – works entirely in the browser
- Supports files up to 2GB (client-side processing)
- Real-time hex editing with undo/redo functionality
- Built-in file signature detection
- Data inspector for interpreting different data types (integers, floats, timestamps, UTF-8 characters)
- Export options for modified files
- Offline mode available (can be downloaded and used without internet)
🔧 Key Features for Forensic Analysis
Search & Navigation
Search for hex patterns, text strings, or go to specific offsets in large files.
Data Inspector
Interpret bytes as integers (8/16/32/64-bit), floats, timestamps (Unix, Windows FILETIME, Mac HFS), and UTF-8 characters.
File Signature Detection
Automatically detects known file signatures (magic bytes) from the start of the file.
🔍 Forensic Use Cases for HexEd.it
- Verify that a file's magic bytes match its extension (e.g., PDF should start with
%PDF) - Detect file type spoofing (e.g., EXE disguised as JPEG)
- Identify unknown or corrupted files by examining headers
- Examine PE (Portable Executable) headers for suspicious characteristics
- Extract embedded strings and URLs from binaries
- Identify packed or obfuscated code patterns
- Locate file headers and footers for manual carving
- Recover deleted file fragments from unallocated space
- Validate carved file integrity
- Examine embedded metadata not visible in standard viewers
- Detect hidden data or steganography at the byte level
- Analyze file structure anomalies
📌 How to Use HexEd.it for Forensic Analysis
- Visit https://hexed.it/ in your browser
- Click "Open File" or drag and drop your suspicious file
- View the hex dump (left column: hex bytes, right column: ASCII/UTF-8 interpretation)
- Use the Data Inspector panel to interpret values at the cursor position
- Click on any byte to see its decimal, octal, and binary representation
- Press Ctrl+F to search for hex patterns or text strings
- Use the offset bar to navigate to specific positions in the file
- Edit bytes directly by typing new hex values (if authorized)
- Export the modified file using File → Export
[Screenshot: HexEd.it interface showing hex dump of a PDF file with %PDF header highlighted]
25 50 44 46 ( %PDF ) header
📋 Common File Signatures to Look For
| File Type | Hex Signature (Magic Bytes) | ASCII Representation |
|---|---|---|
25 50 44 46 |
%PDF |
|
| JPEG | FF D8 FF |
ÿØÿ |
| PNG | 89 50 4E 47 0D 0A 1A 0A |
‰PNG␍␊␚␊ |
| ZIP (including DOCX, XLSX) | 50 4B 03 04 |
PK␃␄ |
| ELF (Linux Executable) | 7F 45 4C 46 |
␡ELF |
| Windows EXE/DLL | 4D 5A |
MZ |
- Cross-platform (works on Windows, Mac, Linux, ChromeOS)
- No installation or administrative privileges required
- Can be used offline after initial load
- Free and open-source
- Handles large files efficiently
- Online tool – files are processed locally, but verify privacy policy
- Limited advanced analysis features compared to dedicated hex editors
- No built-in scripting or automation
HexEd.it processes files entirely in your browser (client-side). No data is uploaded to any server. However, for highly sensitive evidentiary files, use offline hex editors like HxD (Windows) or Bless (Linux) as a best practice.
- HxD (Windows): Free, fast, portable hex editor – https://mh-nexus.de/en/hxd/
- Bless (Linux): Open-source hex editor for GNOME
- 010 Editor (Windows/Mac/Linux): Commercial with advanced binary templates
- ImHex (Cross-platform): Modern hex editor with pattern language support
Resource 2: File Signatures (Magic Bytes) Database
File signatures (also known as magic numbers, magic bytes, or file headers) are unique byte sequences at the beginning (and sometimes end) of files that identify the file format. The Wikipedia List of File Signatures is an invaluable reference for forensic investigators performing file carving, file type verification, and malware analysis.
- Verify file type integrity (does a .pdf file actually start with %PDF?)
- Detect file type spoofing (malware disguised as images or documents)
- Support file carving when file system metadata is missing or corrupted
- Identify unknown or corrupted files during incident response
- Validate recovered files after data recovery operations
📖 What are File Signatures (Magic Bytes)?
A file signature is a unique sequence of bytes, typically at the very beginning (offset 0) of a file, that identifies the file format. These signatures are also called magic numbers or magic bytes. When a file is viewed as raw binary data, these signatures act as "fingerprints" that tell forensic tools and operating systems how to interpret the file's contents.
⚙️ How File Signatures Work
┌─────────────────────────────────────────────────────────────────────────────┐
│ FILE SIGNATURE EXAMPLE │
├─────────────────────────────────────────────────────────────────────────────┤
│ │
│ PDF File: │
│ ┌────┬────┬────┬────┬────┬────┬────┬────┬─────────────────────────────┐ │
│ │ 25 │ 50 │ 44 │ 46 │ 2D │ 31 │ 2E │ 34 │ ... │ │
│ └────┴────┴────┴────┴────┴────┴────┴────┴─────────────────────────────┘ │
│ % P D F - 1 . 4 │
│ │
│ PNG File: │
│ ┌────┬────┬────┬────┬────┬────┬────┬────┬─────────────────────────────┐ │
│ │ 89 │ 50 │ 4E │ 47 │ 0D │ 0A │ 1A │ 0A │ ... │ │
│ └────┴────┴────┴────┴────┴────┴────┴────┴─────────────────────────────┘ │
│ ‰ P N G ␍ ␊ ␚ ␊ │
│ │
│ ZIP File (including DOCX, XLSX, PPTX, JAR, APK): │
│ ┌────┬────┬────┬────┬─────────────────────────────────────────────────┐ │
│ │ 50 │ 4B │ 03 │ 04 │ ... │ │
│ └────┴────┴────┴────┴─────────────────────────────────────────────────┘ │
│ P K ␃ ␄ │
│ │
│ Windows EXE: │
│ ┌────┬────┬────────────────────────────────────────────────────────────┐ │
│ │ 4D │ 5A │ ... │ │
│ └────┴────┴────────────────────────────────────────────────────────────┘ │
│ M Z │
└─────────────────────────────────────────────────────────────────────────────┘
📋 Common File Signatures Reference (Quick Lookup)
| File Extension | Hex Signature (Start of File) | ASCII Representation | Typical Offset |
|---|---|---|---|
| 🖼️ Images | |||
| JPEG/JPG | FF D8 FF | ÿØÿ | 0 |
| PNG | 89 50 4E 47 0D 0A 1A 0A | ‰PNG␍␊␚␊ | 0 |
| GIF87a | 47 49 46 38 37 61 | GIF87a | 0 |
| GIF89a | 47 49 46 38 39 61 | GIF89a | 0 |
| BMP | 42 4D | BM | 0 |
| TIFF (little-endian) | 49 49 2A 00 | II*␀ | 0 |
| TIFF (big-endian) | 4D 4D 00 2A | MM␀* | 0 |
| 📄 Documents | |||
25 50 44 46 | %PDF | 0 | |
| Microsoft Office (DOCX/XLSX/PPTX) | 50 4B 03 04 (ZIP format) | PK␃␄ | 0 |
| Microsoft Office (OLD DOC/XLS/PPT) | D0 CF 11 E0 A1 B1 1A E1 | ÐÏ␑ࡱ␚á | 0 |
| RTF | 7B 5C 72 74 66 31 | {\rtf1 | 0 |
| 🗜️ Archives & Compressed | |||
| ZIP | 50 4B 03 04 | PK␃␄ | 0 |
| RAR (v1.5+) | 52 61 72 21 1A 07 00 | Rar!␚␇␀ | 0 |
| 7z | 37 7A BC AF 27 1C | 7z¼¯'␜ | 0 |
| GZIP | 1F 8B | ␟‹ | 0 |
| XZ | FD 37 7A 58 5A 00 | ý7zXZ␀ | 0 |
| TAR | 75 73 74 61 72 00 30 30 | ustar␀00 | 257 |
| ⚡ Executables | |||
| Windows EXE/DLL | 4D 5A | MZ | 0 |
| ELF (Linux/Unix) | 7F 45 4C 46 | ␡ELF | 0 |
| Mach-O (macOS) | FE ED FA CE (32-bit) / FE ED FA CF (64-bit) | þíúÎ / þíúÏ | 0 |
| Java Class | CA FE BA BE | Êþº¾ | 0 |
| 🎵 Audio / 🎬 Video | |||
| MP3 (with ID3 tag) | 49 44 33 | ID3 | 0 |
| MP3 (no ID3) | FF FB or FF F3 or FF F2 | ÿû / ÿó / ÿò | 0 |
| WAV | 52 49 46 46 + size + 57 41 56 45 | RIFF....WAVE | 0 |
| AVI | 52 49 46 46 + size + 41 56 49 20 | RIFF....AVI␠ | 0 |
| MP4 (ISO Base Media) | 66 74 79 70 69 73 6F 6D | ftypisom | 4 |
| MKV/WebM | 1A 45 DF A3 | ␚Eߣ | 0 |
| 🔧 Other Forensic Artifacts | |||
| Windows Registry (hive) | 72 65 67 66 | regf | 0 |
| Windows Event Log (EVTX) | 45 6C 66 46 69 6C 65 | ElfFile | 0 |
| SQLite Database | 53 51 4C 69 74 65 20 66 6F 72 6D 61 74 20 33 00 | SQLite format 3␀ | 0 |
| PCAP (network capture) | D4 C3 B2 A1 (little-endian) or A1 B2 C3 D4 (big-endian) | Ôò¡ / ¡²ÃÔ | 0 |
| PCAPNG | 0A 0D 0D 0A | ␊␍␍␊ | 0 |
| Forensic Image (E01) | 45 56 46 | EVF | 0 |
| VMware Virtual Disk (VMDK) | 4B 44 4D | KDM | 0 |
🔍 Forensic Applications of File Signatures
📁 File Type Verification
Verify that a file's extension matches its actual content. Example: A file named document.pdf should start with %PDF.
🕵️ Malware Detection
Identify executable files disguised as images or documents (e.g., .exe renamed to .jpg).
📂 File Carving
Recover files from unallocated space by searching for known file signatures (headers and footers).
🔐 File Corruption Analysis
Identify damaged or truncated files by examining missing or incorrect signatures.
🛠️ Forensic Tools That Rely on File Signatures
| Tool | Purpose | Signature Usage |
|---|---|---|
| Binwalk | Firmware & embedded file analysis | Scans for known file signatures to identify embedded files |
| Foremost / Scalpel | File carving | Uses signature configuration files to carve files from raw data |
| file (Linux command) | File type identification | Reads magic bytes and compares against /usr/share/magic database |
| HexEd.it | Hex editing & analysis | Automatically detects and displays detected file signatures |
💻 Command Line: Identifying File Signatures
# Linux 'file' command - identifies file type using magic bytes
$ file suspicious_file
suspicious_file: PNG image data, 800 x 600, 8-bit/color RGB, non-interlaced
# Using xxd to view hex dump (first 16 bytes)
$ xxd -l 16 suspicious_file
00000000: 8950 4e47 0d0a 1a0a 0000 000d 4948 4452 .PNG........IHDR
# Using hexdump
$ hexdump -C -n 16 suspicious_file
00000000 89 50 4e 47 0d 0a 1a 0a 00 00 00 0d 49 48 44 52 |.PNG........IHDR|
# Using dd to extract header
$ dd if=suspicious_file bs=16 count=1 | xxd
1+0 records in
1+0 records out
00000000: 8950 4e47 0d0a 1a0a 0000 000d 4948 4452 .PNG........IHDR📚 Additional File Signature Resources
Wikipedia List
Comprehensive community-maintained databaseGary Kessler's Table
Detailed file signatures with notesFile Signatures Database (GitHub)
Machine-readable JSON/CSV databases- Malware hiding (e.g., .exe renamed to .pdf)
- File corruption or incomplete recovery
- Deliberate anti-forensic techniques
- Incorrect file type identification by the operating system
❓ Cyber Forensics Interview Questions & Answers
This comprehensive Q&A module covers essential digital forensics concepts for interview preparation, certification exams (CHFI, GCFE, GCFA, CCFE), and practical investigations. Each question includes detailed answers, real-world context, and forensic best practices.
Focus on the forensic process, chain of custody, and legal standards — these are critical in court.
📚 Forensics Fundamentals
Q1 – What is Digital Forensics?
Digital Forensics is the discipline of identifying, preserving, analyzing, and presenting digital evidence in a legally acceptable manner. It applies scientific methods to investigate cybercrimes, data breaches, insider threats, and policy violations.
Q2 – What are the Phases of Digital Forensics Investigation?
- Identification – Detecting incident indicators and scope definition
- Preservation – Securing and isolating evidence (chain of custody)
- Collection – Acquiring forensic images and volatile data
- Examination – Processing and extracting relevant data
- Analysis – Interpreting data to answer investigative questions
- Presentation – Reporting findings for legal proceedings
Q3 – What is Chain of Custody and Why is it Important?
Chain of Custody is the documented chronological record of evidence handling from collection to court presentation. It proves evidence integrity and prevents tampering allegations.
📋 Required Documentation Elements:
- Evidence ID and description
- Date and time of collection
- Collector's name and signature
- Each transfer of custody with signatures
- Storage location and security measures
Q4 – Order of Volatility – What Data to Collect First?
The Order of Volatility (RFC 3227) prioritizes data collection from most to least volatile:
- CPU registers, cache, RAM contents
- Routing tables, ARP cache, process tables
- Live network connections and open ports
- Running system logs and audit trails
- Hard disk and storage media data
- Backups, archives, and offline storage
Q5 – Forensic Image vs Standard Backup – Key Differences
| Aspect | Forensic Image | Standard Backup |
|---|---|---|
| Data Included | All sectors (deleted, slack, unallocated) | Only live files |
| Format | E01, RAW, AFF (with metadata) | ZIP, TAR, proprietary |
| Integrity | Hash-verified (MD5/SHA256) | Not guaranteed |
| Purpose | Legal evidence | Disaster recovery |
📦 Evidence Collection & Preservation
Q6 – What is a Write Blocker? When is it Used?
A Write Blocker is a hardware or software device that prevents any modification to a storage device during forensic acquisition. It is used whenever accessing original evidence to maintain integrity.
Types of Write Blockers:
- Hardware Write Blockers – Tableau, WiebeTech (court-preferred, OS-independent)
- Software Write Blockers – FTK Imager read-only mode, Linux mount -r (free but less trusted)
Q7 – Live Forensics vs Dead Forensics – When to Use Each?
- Live Forensics: System is running — captures RAM, processes, network connections. Used when volatile data is critical or disk encryption is present.
- Dead Forensics: System is powered off — captures disk images. Used when integrity is paramount and volatile data is not needed.
Q8 – What Hash Algorithms are Used in Forensics?
- MD5 – 128-bit, legacy (collision vulnerable but still accepted)
- SHA-1 – 160-bit, deprecated (not recommended for new cases)
- SHA-256 – 256-bit, recommended standard
- SHA-512 – 512-bit, strongest (for high-sensitivity cases)
Q9 – What is a Forensic Image Format (E01)?
E01 (EnCase Evidence File) is the most common forensic image format. It includes:
- Compression to save space
- Metadata (case number, evidence number, examiner)
- Hash values embedded in the file
- Ability to split across multiple files
💽 File System Forensics
Q10 – What is the MFT in NTFS? Why is it Forensically Important?
The Master File Table (MFT) is a database containing a record for every file and folder on an NTFS volume. Each record stores metadata including timestamps, file size, attributes, and data locations.
Forensic Importance: Even deleted files leave MFT records that can be recovered, revealing file names, timestamps, and sometimes partial content.
Q11 – What are MACB Timestamps?
- Modified (M) – File content changed (most reliable)
- Accessed (A) – File opened or read
- Created (C) – File creation time
- Changed (B) – File metadata modified (permissions, attributes)
Q12 – What is Slack Space? What Evidence Can be Found There?
Slack Space is the unused space between the end of a file and the end of its last allocated cluster. It may contain fragments of previously stored files, including sensitive data.
Types of Slack Space:
- RAM Slack – Between file end and sector end (may contain old data from RAM)
- File Slack – Between sector end and cluster end
Q13 – What are Alternate Data Streams (ADS)?
Alternate Data Streams (ADS) are a feature of NTFS that allows additional data to be attached to a file without changing the visible file size. Attackers hide malware in ADS to evade detection.
Detection Methods:
dir /r(Command Prompt)Get-Item -Stream *(PowerShell)- Forensic tools (FTK, EnCase, Autopsy)
Q14 – NTFS vs FAT32 – Forensic Differences
| Feature | NTFS | FAT32 |
|---|---|---|
| Journaling | Yes ($LogFile) | No |
| File Size Limit | 16 EB | 4 GB |
| Alternate Data Streams | Yes | No |
| Forensic Value | Very High | Low |
🪟 Windows Forensics
Q15 – Critical Windows Registry Artifacts
- USB History:
HKLM\SYSTEM\CurrentControlSet\Enum\USBSTOR - Program Execution:
UserAssistsubkeys - Recently Accessed Files:
RecentDocs - Network Shares:
Map Network Drive MRU - Auto-start Programs:
Run,RunOnce
Q16 – Windows Event Logs & Critical Event IDs
- 4624: Successful logon
- 4625: Failed logon (brute-force indicator)
- 4688: Process creation
- 4720: User account created
- 7045: Service installed
- 1102: Audit log cleared (red flag!)
Q17 – Prefetch Files – Program Execution Evidence
Prefetch files (.pf) track program execution on Windows. They record:
- Executable name and path
- Timestamp of last execution
- Number of times executed
- Files and DLLs loaded
Location: C:\Windows\Prefetch\
Q18 – Recycle Bin Forensics ($Recycle.Bin)
The Recycle Bin stores deleted files with original names and paths. Each user has their own subfolder with an INFO2 (Windows XP) or $I/$R (Vista+) file structure.
Q19 – Volume Shadow Copies – Evidence Source
Volume Shadow Copies are automatic backups created by Windows System Restore. They may contain:
- Previous versions of deleted files
- Files before encryption (ransomware cases)
- System state before compromise
Tools: vssadmin, Shadow Explorer, libvshadow
🐧 Linux Forensics
Q20 – Linux File System Structure (EXT4)
EXT4 uses inodes to store metadata about files (permissions, timestamps, ownership, block pointers). The Superblock contains file system metadata and has backups for recovery.
Q21 – Linux Log Files – /var/log/ Analysis
/var/log/auth.log– Authentication attempts (Ubuntu/Debian)/var/log/secure– Authentication (RHEL/CentOS)/var/log/syslog– General system messages/var/log/boot.log– Boot process/var/log/dmesg– Kernel ring buffer
Q22 – Linux Command History – .bash_history
Each user's .bash_history file stores executed commands. Forensic value includes:
- Commands run by attackers
- Files accessed or modified
- Network connections made
- Privilege escalation attempts
history -c or rm ~/.bash_history — but artifacts may remain.🧠 Memory Forensics
Q23 – What is Memory Forensics?
Memory forensics is the analysis of RAM dumps to detect:
- Fileless malware (exists only in RAM)
- Hidden processes (rootkits)
- Network connections
- Decrypted passwords and keys
- Command history
Q24 – Volatility Framework Plugins
- pslist / psscan – List processes (including hidden)
- netscan – Network connections and open ports
- malfind – Detect injected code/DLLs
- cmdscan – Command history from console
- hashdump – Extract password hashes
- timeliner – Create memory timeline
Q25 – Detecting Fileless Malware in RAM
Fileless malware never writes to disk — it exists only in RAM. Detection methods:
- Analyze process memory for anomalies
- Look for PowerShell or WMI suspicious activity
- Detect reflective DLL injection
- Monitor for registry-only persistence
🌐 Network Forensics
Q26 – What is Network Forensics?
Network forensics is the capture, recording, and analysis of network traffic to investigate security incidents, detect intrusions, and reconstruct attacker activities.
Q27 – PCAP Files – What They Contain
PCAP (Packet Capture) files contain raw network packets including:
- Source/destination IP addresses and ports
- Protocol headers (TCP, UDP, ICMP, HTTP, DNS)
- Payload data (if unencrypted)
- Timestamps for each packet
Q28 – Indicators of Compromise (IoCs) in Network Traffic
- Communication with known malicious IPs/domains
- Unusual outbound data transfers (exfiltration)
- DNS queries to suspicious domains (DGA)
- Port scanning patterns
- Unusual protocol usage
📱 Mobile Forensics
Q29 – Mobile Forensics Acquisition Methods
- Manual Extraction: Viewing data on device (photographing)
- Logical Extraction: Backup via iTunes/ADB
- File System Extraction: Full file system (requires root/jailbreak)
- Physical Extraction: Chip-off, JTAG, ISP (advanced)
- Cloud Extraction: iCloud, Google Drive backups
Q30 – iOS vs Android Forensic Challenges
| Challenge | iOS | Android |
|---|---|---|
| Encryption | Default hardware encryption | Varies by manufacturer |
| Bootloader | Locked (jailbreak required) | Unlockable on some devices |
| Backups | iTunes encrypted backups | ADB backups (limited) |
| App Data | Sandboxed, requires backup | File system accessible if rooted |
⚖️ Legal & Compliance
Q31 – Daubert vs Frye Standard
- Frye Standard – Evidence must be "generally accepted" in the scientific community
- Daubert Standard – Judge acts as gatekeeper; factors include testing, peer review, error rate, and general acceptance
Q32 – GDPR & Digital Forensics
GDPR impacts digital forensics by requiring:
- Data minimization – only collect relevant evidence
- Purpose limitation – use data only for investigation
- Right to erasure – delete personal data after case
- Data breach notification – 72-hour window
Q33 – Expert Witness Role in Court
Forensic expert witnesses must:
- Explain technical concepts clearly to non-technical audiences
- Defend methodology and tool selection
- Remain neutral and unbiased
- Present findings based on evidence, not speculation
- Withstand cross-examination
🛠️ Forensic Tools
Q34 – FTK Imager Capabilities
- Create forensic images (E01, RAW, AFF)
- Mount images as read-only drives
- Preview disk contents without modification
- Capture memory (RAM) images
- Generate hash values for verification
- View and export files from images
Q35 – Autopsy/The Sleuth Kit Features
- File system analysis (NTFS, FAT, EXT, HFS+)
- Deleted file recovery
- Registry and event log parsing
- Keyword search and indexing
- Email and web artifact extraction
- Timeline generation
- Hash set filtering (known good/bad files)
Q36 – Wireshark Display Filters
http.request.method == "POST" # POST requests
dns.qry.name contains "malware" # Suspicious DNS
ip.src == 192.168.1.100 # Source IP
tcp.port == 443 # HTTPS traffic
tcp.flags.syn == 1 and tcp.flags.ack == 0 # SYN scans
frame.time >= "2024-01-01" # Time filter📄 Reporting & Certification
Q37 – Forensic Report Structure
- Executive Summary: High-level findings for management
- Scope & Authorization: Investigation boundaries
- Evidence Inventory: List of collected items with hashes
- Methodology: Tools and procedures used
- Findings: Detailed evidence with references
- Timeline: Chronological reconstruction
- Conclusion: Fact-based conclusions
- Appendices: Logs, screenshots, raw data
Q38 – CHFI vs GCFE vs GCFA Certifications
| Certification | Focus | Best For |
|---|---|---|
| CHFI (EC-Council) | Comprehensive forensics | General forensic roles |
| GCFE (SANS FOR500) | Windows forensics | Enterprise investigations |
| GCFA (SANS FOR508) | Advanced incident response | IR and threat hunting |
Q39 – Common Forensic Mistakes to Avoid
- Working on original evidence (always use images)
- Insufficient documentation of actions
- Missing volatile data collection
- Broken chain of custody
- Tool validation not documented
- Assuming instead of proving
- Exceeding legal authority
Q40 – How to Prepare for Forensic Interview
- Master the forensic process (6 phases)
- Understand chain of custody importance
- Know common tool commands (FTK Imager, Autopsy, Volatility)
- Practice timeline analysis scenarios
- Review Windows registry artifacts
- Study event ID significance
- Prepare to explain concepts to non-technical audiences
- Complete hands-on labs (TryHackMe, CyberDefenders)
📚 Related Blogs
🚫 No related blogs available at the moment.